Question 5 A company manufactures a gadget to be used in a very wide temperature .ge. Ine company knows that increased temperature shortens the ifetime of the device, and a study is therefore performed in which the lifetime is detemined as a function of temperature. The following data is found. Temperature (°C) 10 Lifetime (h ours). 380 21 316 30 265 42 202 53 174 113 66 62 70 81 35 92 (a) Construct a linear regression model for the given data. (b) Interpret the relationship between temperature and lifetime of the gadget (c) Estimate the ifetime of the device given temperature of 1°C.
Question 5 A company manufactures a gadget to be used in a very wide temperature .ge. Ine company knows that increased temperature shortens the ifetime of the device, and a study is therefore performed in which the lifetime is detemined as a function of temperature. The following data is found. Temperature (°C) 10 Lifetime (h ours). 380 21 316 30 265 42 202 53 174 113 66 62 70 81 35 92 (a) Construct a linear regression model for the given data. (b) Interpret the relationship between temperature and lifetime of the gadget (c) Estimate the ifetime of the device given temperature of 1°C.

Algebra & Trigonometry with Analytic Geometry
13th Edition
ISBN:9781133382119
Author:Swokowski
Publisher:Swokowski
Chapter5: Inverse, Exponential, And Logarithmic Functions
Section5.6: Exponential And Logarithmic Equations
Problem 70E

Related questions
Question
100%
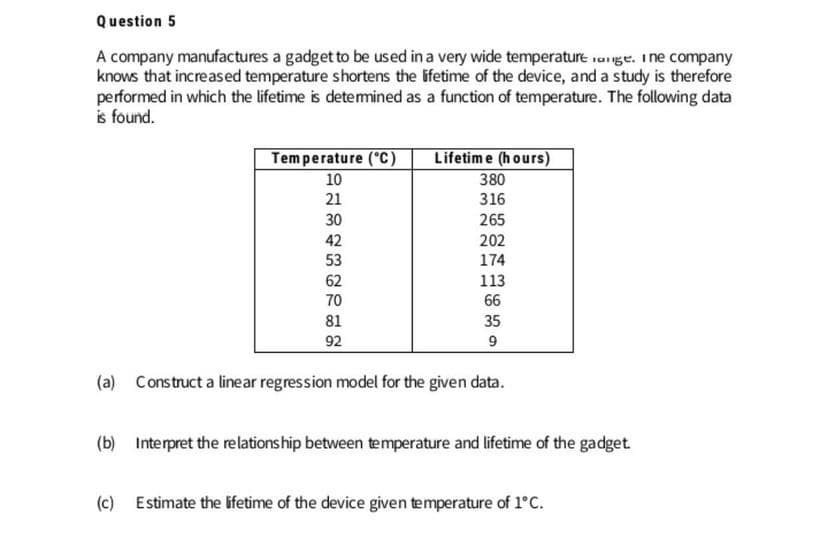
Transcribed Image Text:Question 5
A company manufactures a gadget to be used in a very wide temperature .age. Ine company
knows that increased temperature shortens the ifetime of the device, and a study is therefore
performed in which the lifetime is detemined as a function of temperature. The following data
is found.
Temperature (°C)
10
Lifetim e (h ours)
380
21
316
30
265
42
202
53
174
62
113
70
66
81
35
92
9
(a) Construct a linear regression model for the given data.
(b) Interpret the relationship between temperature and lifetime of the gadget.
(c) Estimate the lifetime of the device given temperature of l°C.
Expert Solution
This question has been solved!
Explore an expertly crafted, step-by-step solution for a thorough understanding of key concepts.

Step by step
Solved in 2 steps with 2 images

Recommended textbooks for you
Algebra & Trigonometry with Analytic Geometry
Algebra
ISBN:
9781133382119
Author:
Swokowski
Publisher:
Cengage

Algebra & Trigonometry with Analytic Geometry
Algebra
ISBN:
9781133382119
Author:
Swokowski
Publisher:
Cengage