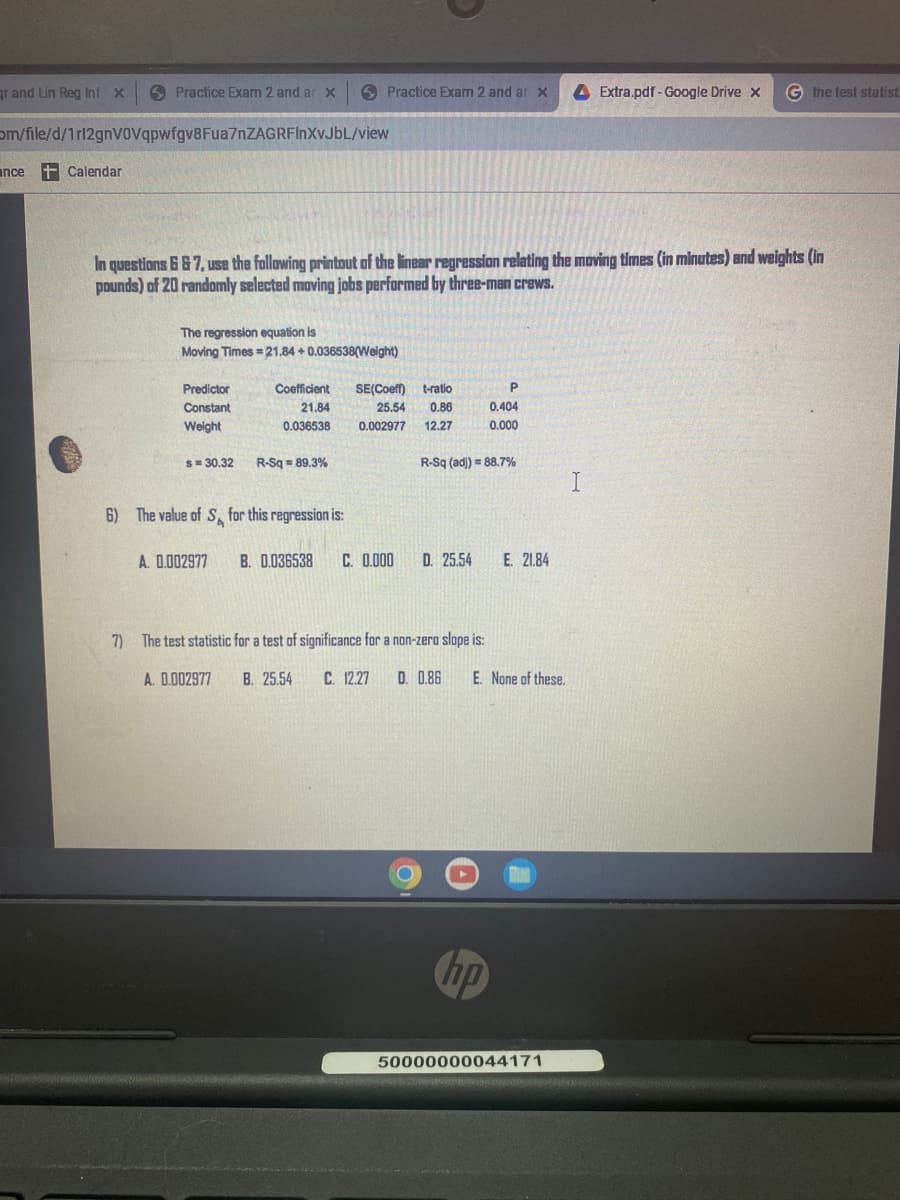
In questions 6 & 7, use the following printout of the linear regression relating the moving times (in minutes) and weights (in pounds) of 20 randomly selected moving jobs performed by three-man crews.
Q: You wish to test the following claim (Ha) at a significance level of a = 0.005. Ho:µ = 66.6 Ha:µ +…
A:
Q: Based on the frequency distribution above, find the relative frequency for the class with lower…
A: The relative frequeny is defined as Relative frequency = frequency/Total frequency
Q: Identidication: Determine the Parameter In the given situation and it’s corresponding inequality.…
A: The objective is to identify the appropriate parameter (i.e., the value that explains the…
Q: The following data refer to visual defects found at inspection of 10 sam ples of size 100. Use tbem…
A:
Q: i have the following regression equation Log(total deaths per million) = -3.882 + 0.934Log(total…
A: For example: The slope coefficients is given as 2 this can be interpreted as if there will be one…
Q: Adidas X Parley sports shoes are also sold through the retailers.
A: The given data is supposedly collected using a Questionnaire made using Google forms. The…
Q: Teacher Strikes In Pennsylvania the numbers of teacher strikes for the last 14 years are shown. 9 13…
A: We have to answer the question with dot- plot from given data
Q: Suppose you want to estimate the proportion of traditional college students on your campus who own…
A:
Q: Họ : µ = 180.8 Hị : µ + 180.8 pe carried out for a popula n A random samnle of 24
A: A random sample of 24 yields; n=24 Mean of random sample is 176.1 and the test statistic is -1.82740…
Q: An article in Plant Disease, "Effect of Nitrogen and Potassium Fertilizer Rates on Severity of…
A:
Q: What type of hypothesis testing to be used if the word "not equal" is stated in the alternative…
A: 3) Not equal is used in the Two-tailed test.
Q: How much does a sleeping bag cost? Let's say you want a sleeping bag that should keep you warm in…
A: Given By using Excel formula Mean =Average(data) Standard Deviation =STDEV.S(data)
Q: Select the most appropriate answer. In a negative association between two quantitative variables, y…
A: In Negative association between two quantitative variables is as one variable increases the other…
Q: There are 5000 observations in a data set. 10% of the data are “1”s, while the rest are “0”s. If we…
A: The data set consist of 5000 observations. The observations are 0's and 1's. An amount of data…
Q: Cu Absorbance 1 Absorbance 2 Absorbance 3 Mean + SD standard (ppm) 1 0.0521 0.0520 0.0522 2 0.1011…
A: Measure of central tendency explains the average measurement of observations. Central tendency…
Q: among federally funded high schools. The response variable is MathAch where higher scores are…
A: *Answer:
Q: Use a table of areas for the standard normal curve to find the required z-score. Find the z-score…
A:
Q: 3.The process of taking into account a related factor can (pick the best) Select one: a. reverse an…
A: The process of taking into account a related factor can:
Q: S(z|4, A) = () the statistics `X and 1=E in ent and complete. , show that X has an inverse Gaussian…
A: *Answer:
Q: A researcher looks at the mean salaries of male and female electricians and decides based on the…
A:
Q: Use the mixed congruential method to generate a sequence of 32 random numbers with Xo=8, a=9, c=13,…
A:
Q: Use the data to the right to complete Percentage Who parts (a) through (d) below. Won't Try Don't…
A: X Y X.Y X2 Y2 44 36 1584 1936 1296 50 43 2150 2500 1849 60 53 3180 3600 2809 78 69 5382 6084…
Q: 5) randomly selected gas stations from a Assume that the The following data shows the gas prices…
A: ( i ) Find 95% C.I and interpret ( ii ) Find 99% C.I and interpret ( iii ) Compare the two…
Q: The age distribution of workers in a factor is as follows: Marks 16-25 26-35 36-45 46-55…
A: “Since you have posted a question with multiple sub-parts, we will solve the first three sub-parts…
Q: The following is a list of hospitals in Pasig City. We are interested in estimating the average…
A: Solution: The list of hospitals are given and numbered from 1 to 20.
Q: (5) If X is any random variable, then the inequality, |E[X]<E\X\ exists
A:
Q: stationery store wants to estimate the mean retail value of greeting cards that it has in its…
A:
Q: 2:35 4 Feels Close to People at their School Feels Sad or or Hopeless Strongly Agree Agreed Unsure…
A: The chi-square contingency table and the software output for the chi-square test of independence is…
Q: Problem 1 A particular language certificate is earned after taking three annual exams (type I, II,…
A:
Q: The correlation matrix is useless for revealing multicollinearity in a multiple regression problem…
A: Multicollinearity is a situation where two or more independent variables are highly correlated to…
Q: The prediction error for an observation, which is the difference between the actual value and the…
A: here use basic of regression
Q: The table below gives the number of seasons that each of the main six colors of Power Range appeared…
A: The bar graph is displayed in the below step.
Q: Suppose that we reject a null hypothesis at the 0.1 level of significance. Then for which of the…
A:
Q: Select the most appropriate answer. Planning the methods for data collection to study the effects of…
A: Statistics involved three types of aspects. They are design, description and inference. Design…
Q: 1.Weight-loss study. Doctors give a new weight-loss pill to those who request it. Not everyone does,…
A: It is an observational study.
Q: The following table lists the heights (in inches) and weights (in pounds) for a sample of National…
A:
Q: Let X and Y be two contimuous random variables with joint probability density function given by:…
A: Option B is the answer.
Q: A case-control study was conducted to evaluate the relationship between aspirin use and the risk of…
A: An odds ratio quantifies the strength of the association between two events A and B. It is defined…
Q: An article in the IEEE Transactions on Electron Devices (November 1986, p. 1974) describes a study…
A:
Q: e) The unit nonresponse occurs when a unit has responses to some but not all of the items in the…
A: Given problem Given that The unit nonresponse occurs when a unit has response to some but not…
Q: Life on Other Planets Forty-three percent of people believe that there is life on other planets in…
A:
Q: What is the degree of freedom between groups? What is the degree of freedom within groups? What is…
A: The provided information is There are 10 families in Makati and 12 families in Quezon. a=10, s=12…
Q: Due to the Covid-19 epidemic. Many shops went online. One of them is an online restaurant. It claims…
A:
Q: following hypothesis test: Ho : µi – 42 12 - Population 1 is known to have ơj = 2.31. A sample of…
A:
Q: Please help me find answers 1-6 for this data set. Thanks! 1. class width 2. class limits 3.…
A:
Q: Suppose that 3 cards are drawn from a well-shuffled deck of 52 cards. What is the probability that…
A:
Q: In a random sample of eleven people, the mean driving distance to work was 25.7 miles and the…
A: Given that, n=no. of sample=11 x=mean=25.7 s=standard deviation=4.1 Confidence interval is 99%
Q: For this problem, carry at least four digits after the decimal in your calculations. Answers may…
A:
Q: Question * The joint probability density function for X and Y is given by: ((x+y) f(x,y) = x > 0, y…
A: Solution
Q: Quality control is maintained in a factory with the help of mean X and standard deviation o charts.…
A:
Step by step
Solved in 2 steps
- Olympic Pole Vault The graph in Figure 7 indicates that in recent years the winning Olympic men’s pole vault height has fallen below the value predicted by the regression line in Example 2. This might have occurred because when the pole vault was a new event there was much room for improvement in vaulters’ performances, whereas now even the best training can produce only incremental advances. Let’s see whether concentrating on more recent results gives a better predictor of future records. (a) Use the data in Table 2 (page 176) to complete the table of winning pole vault heights shown in the margin. (Note that we are using x=0 to correspond to the year 1972, where this restricted data set begins.) (b) Find the regression line for the data in part ‚(a). (c) Plot the data and the regression line on the same axes. Does the regression line seem to provide a good model for the data? (d) What does the regression line predict as the winning pole vault height for the 2012 Olympics? Compare this predicted value to the actual 2012 winning height of 5.97 m, as described on page 177. Has this new regression line provided a better prediction than the line in Example 2?The following fictitious table shows kryptonite price, in dollar per gram, t years after 2006. t= Years since 2006 0 1 2 3 4 5 6 7 8 9 10 K= Price 56 51 50 55 58 52 45 43 44 48 51 Make a quartic model of these data. Round the regression parameters to two decimal places.Suppose a study wants to predict the market price of a certain species of turtle (Y) based on the following independent variables indicated in the table. Based from the table, what is the equation of the multiple linear regression? (Round off up to two decimal places. Market Price = 0.07 - 0.40*weight + 1.51*length + 1.41*width + 0.80*age Market Price = - 0.40*weight + 1.51*length + 1.41*width + 0.80*age Market Price = 0.07 + 0.40*weight + 1.51*length + 1.41*width + 0.80*age Market Price = 0.07 - 0.40 + weight + 1.51 + length + 1.41 + width + 0.80 + age
- he following table shows the annual number of PhD graduates in a country in various fields. NaturalSciences Engineering SocialSciences Education 1990 70 10 60 30 1995 130 40 100 50 2000 330 130 280 140 2005 490 370 460 210 2010 590 550 830 520 2012 690 590 1,000 900 (a)With x = the number of social science doctorates and y = the number of education doctorates, use technology to obtain the regression equation. (Round coefficients to three significant digits.) y(x) = Use technology to obtain the coefficient of correlation r. (Round your answer to three decimal places.) r =And run a simple linear regression in SPSS to determine if pulse at warm-up (The name of the variable in SPSS is "stage 1" and its label is "pulse at warmup") significantly predicts pulse while running ( The name of the variable in SPSS is "stage 3" and its label is "pulse running"). Use α = .05 Is the regression equation significant? That is, does pulse at warm-up explains (or predicts) a significant amount of variability in pulse while running? Report the F, df (of numerator, and df of the denominator) and p-value.A U.S. state's Bureau of Economic Geology published a study on the economic impact of using carbon dioxide enhanced oil recovery (EOR) technology to extract additional oil from fields that have reached the end of their conventional economic life. The following table gives the approximate number of jobs for the citizens that would be created at various levels of recovery. Percent Recovery (%) 20 40 80 100 Jobs Created (Millions) 6 9 12 18 Find the regression line. j(r) = Use the regression line to estimate the number of jobs that would be created at a recovery level of 60%. _____ million jobs
- The table contains data on vehicle speed (h) and fuel consumption (lt / 100km) of 5 randomly selected vehicles. Estimate the average fuel consumption of a vehicle traveling at 45 km / h using the simple linear regression equation between vehicle speed and fuel consumption. Speed 55 60 65 70 75 Consumption 11 10 9 8 7 Please choose one: a. 6 b. 5 c. 13 D. 8Suppose a farmer collects data about the eggs their chickens are producing. They find that the average diameter of the eggs is 40 mm, with an SD of 3 mm. The average weight is 60 g, with an SD of 4 g. The correlation between the two variables is r = 0.62, and the scatterplot looks football shaped. True or False: It is appropriate to interpret the intercept of the regression line. Group of answer choices True FalseWhich of the following does not need to be computed to determine a simple regression line? SSx SP "Y-hat" SSy
- The following table shows the annual number of PhD graduates in a country in various fields. NaturalSciences Engineering SocialSciences Education 1990 70 10 60 30 1995 130 40 120 50 2000 330 130 280 140 2005 490 370 460 210 2010 590 550 830 520 2012 690 590 1,000 900 (a) With x = the number of social science doctorates and y = the number of education doctorates, use technology to obtain the regression equation. (Round coefficients to three significant digits.) y(x) = Graph the associated points and regression line. (b) What does the slope tell you about the relationship between the number of social science doctorates and the number of education doctorates? The slope tells us the increase in the number of education doctorates for each additional social science doctorate.The slope tells us the decrease in the number of education doctorates for each additional social science doctorate. The slope tells us the increase in the number…The following table shows the annual number of PhD graduates in a country in various fields. NaturalSciences Engineering SocialSciences Education 1990 70 10 70 30 1995 130 40 110 50 2000 330 130 280 140 2005 490 370 460 210 2010 590 550 830 520 2012 690 590 1,000 900 (a) With x = the number of social science doctorates and y = the number of education doctorates, use technology to obtain the regression equation. (Round coefficients to three significant digits.) y(x) = Graph the associated points and regression line. (b) What does the slope tell you about the relationship between the number of social science doctorates and the number of education doctorates? The slope tells us the increase in the number of social science doctorates for each additional education doctorate.The slope tells us the increase in the number of education doctorates for each additional social science doctorate. The slope tells us the decrease in the number…The following is the estimation results for a multiple linear regression model: Y = Bo + BX, + Bxz + 8 SUMMARY OUTPUT Regression Statistics R-Square Regression Standard Error (S) Observations 0.558 863.100 35 Coeff StdError 1283.000 352.000 25.228 8.631 0.861 0.372 t-Stat 3.65 Intercept X] X2 Questions: Write the fitted regression equation (30 points). 2 Write the estimated intercepts and slopes, associated with their corresponding standard errors (30 points). 3 Interpret each coefficient.