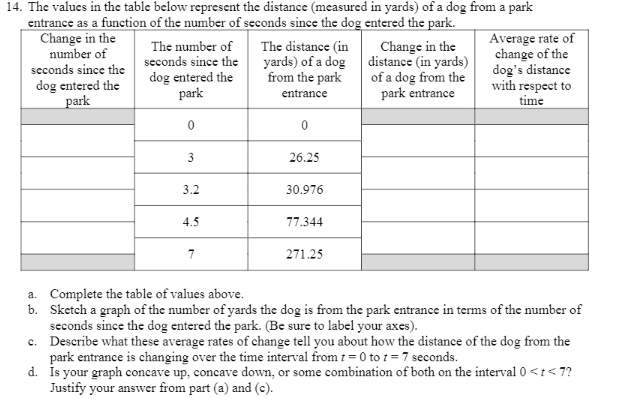
14. The values in the table below represent the distance (measured in yards) of a dog from a park entrance as a function of the number of seconds since the dog entered the park. Change in the number of seconds since the Average rate of change of the dog's distance with respect to time The number of seconds since the The distance (in yards) of a dog distance (in yards) from the park entrance Change in the dog entered the park dog entered the park of a dog from the park entrance 26.25 3.2 30.976 4.5 77.344 7 271.25 a. Complete the table of values above. b. Sketch a graph of the number of yards the dog is from the park entrance in terms of the number of seconds since the dog entered the park. (Be sure to label your axes). c. Describe what these average rates of change tell you about how the distance of the dog from the park entrance is changing over the time interval from t = 0 to 1 = 7 seconds. d. İs your graph concave up, concave down, or some combination of both on the interval 0 < t< 7? Justify your answer from part (a) and (c).


Unitary Method
The word “unitary” comes from the word “unit”, which means a single and complete entity. In this method, we find the value of a unit product from the given number of products, and then we solve for the other number of products.
Speed, Time, and Distance
Imagine you and 3 of your friends are planning to go to the playground at 6 in the evening. Your house is one mile away from the playground and one of your friends named Jim must start at 5 pm to reach the playground by walk. The other two friends are 3 miles away.
Profit and Loss
The amount earned or lost on the sale of one or more items is referred to as the profit or loss on that item.
Units and Measurements
Measurements and comparisons are the foundation of science and engineering. We, therefore, need rules that tell us how things are measured and compared. For these measurements and comparisons, we perform certain experiments, and we will need the experiments to set up the devices.


Trending now
This is a popular solution!

Step by step
Solved in 4 steps with 2 images


