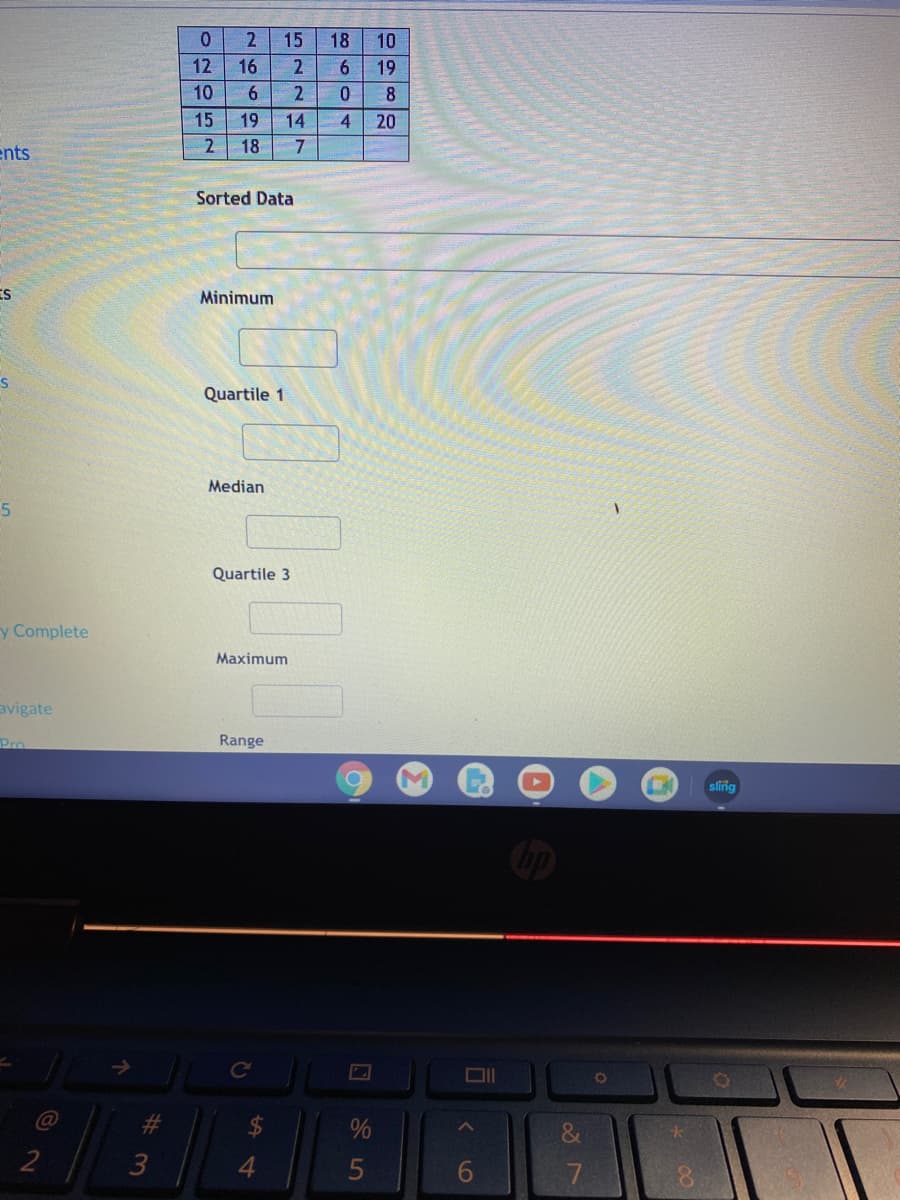
15 18 10 12 16 2 6. 19 10 6. 2. 0. 15 19 14 4. 20 18 7. Sorted Data Minimum Quartile 1 Median Quartile 3 Maximum Range
Q: Find the measures of center for following. Data Frequency 30 - 34 1 35 - 39 0 40 - 44 4…
A: Consider the preliminary calculations given below:
Q: 15. Twenty seeds were sown in each of 100 trays and the number of seeds that germinated was…
A: For the given data Find (a) compute mean =?median =? mode =? (b) which would be best average ?
Q: Approximate the measures of center for following GFDT. Data Frequency 40-44 2. 45-49 50 -54 15 55-59…
A: Mean: The mean is the sum of observations divided by the number of observations. that is,Mean =…
Q: a) Which season has the lower median temperature: [ Select ] b) Which season has the larger IQR…
A: The boxplot shows the minimum, first quartile, median, third quartile and maximum value.
Q: Attached is the dataset: 17) Looking at the graph on Pupal Mass vs Development Time, what type of…
A:
Q: 아 3 4 5 6. c1 Center: Mean: Median: Variation: St. Dev.: Range: 5-Number Summary: Min.: Q1: Q2: Q3:…
A: The given Dot-plot shows data values with their frequencies S.No. Data value frequency 1 2 3…
Q: Approximate the measures of center for following GFDT. Data Frequency 40 - 44 45 - 49 50 - 54 13 55…
A: Solution: To find: 1.Mode 2.Median 3. Mean
Q: 5. The first quartile (Q1) for the data set: 23, 24, 21, 20, 25, 22, 18 , 15
A: Given data 23,24,21,20,25,22,18,15 Q1=?
Q: 6. What is the marginal relative frequency of track club members who are girls? * West Junior High…
A:
Q: 2 13 14 15 16 17 18 19 20 21 22 23 Price ($1000) Dissolved oxygen The level of dissolved oxygen (DO)…
A: From the given box plot we want to know given distribution is normal or not.
Q: Approximate the measures of center for following GFDT. Data Frequency 40 - 44 45 49 50 54 4 55 -59…
A: From the given information, x=mid values frequency 42 1 47 0 52 2 57 3 62 5 67 9…
Q: Approximate the measures of center for following GFDT. Data Frequency 40 -44 45 - 49 50 - 54 11 55 -…
A: Given data is appropriate to find measures of central tendency to find the central value.
Q: (a) Provide a point estimate of the population mean number of weeks it takes a worker aged 55 plus…
A: X (x-xbar)^2 21 1 14 64 51 841 16 36 17 25 14 64 16 36 12 100 48 676 0 484 27…
Q: Q2: At SQU hospital there is some concern about the high turnover of nurses. A survey was done to…
A: Given : At SQU hospital there is some concern about high turnover of nurses . A survey was done to…
Q: (a) The coefficient of determination of the expanded data set is R? = %. (Round to one decimal place…
A: A)
Q: 8. 6 1 16 21 data 26 31 Based on the histogram above, what is the frequency of the class containing…
A:
Q: The Editor's Report in the November 2003 issue of Technometrics provides the following information…
A:
Q: Approximate the measures of center for following GFDT. Data Frequency 30 - 34 35 - 39 10 21 40 - 44…
A: Calculate Mean, Median, Mode from the following grouped data Class Frequency 30 - 34 10 35 -…
Q: 15 22 12 21 26 18 42 29 64 20 15 22 18 24 27 24 26 19 a. Compute the mean and median percentage of…
A: As per Guidelines we are suppose to do only three subparts
Q: 20 22 24 26 28 30 32 34 Lower Quartile Upper Quartile Lower Extreme Upper Extreme Median Range…
A: Lower Quartile= 22 Upper Quartile = 27 Lower Extreme = Minimum = 20 Upper Extreme = Maximum = 30
Q: 6. 10 11 12 13 14 15 16 data Based on the boxplot above, identify the 5 number summary (min, Q1,…
A:
Q: 8. Which assumption about the data set is being checked in this plot? A. normality assumption B.…
A: The plot of residuals versus the factor levels are given and objective is to find to check which…
Q: 2. Research Question: Does the treatment result in a lower completion time (group 1 treatment, 0 =…
A: Here, to check : H0: μ1=μ2 vs H0: μ2<μ1 μ1: population mean oftreatment group μ2:…
Q: 19. A very large number is added tó å data set Of 99 much smaller numbers to make a data set of. 100…
A: Given that, A very large number is added to a data set of 99 much smaller numbers to make a data set…
Q: Approximate the measures of center for following GFDT. Data Frequency 40 - 44 13 45 - 49 19 50 -…
A:
Q: 5. (No computer output is accepted) Maxwell's hot chocolate is concerned about the effect of the…
A: Please find step by step solution below. The problem can be solved using t-test statistics.
Q: 5. Given: CLASS LIMITS FREQUENCY 61 63 64 66 67 69 12 70 72 15 73 75 8. 76 78 79 81 olve for the…
A: Given data : Class limit Frequency 61 - 63 2 64 - 66 5 67 - 69 12 70 - 72 15 73 - 75 8…
Q: 18.00 24.70 23.40 30.70 26.90 21.20 19.80 21.80 27.10 29.20 18.80 16.70 25.00 Problem Solving:…
A: The test significance difference between the mean of sample and the population is calculated for the…
Q: 10 30 40 50 (a) Draw the scatter graph of this set of data. (b) Compute the correlation coefficient…
A: 9. (a) The scatter plot is obtained using EXCEL. The software procedure is given below: Enter the…
Q: Find the following measures of dispersion for the data below: 2 6 16 11 2 16 4 13 17 20 18 2 4 9. 13…
A: The sorted data is given as: 2 2 2 3 4 4 6 6 7 8 9 11 11 13 13 14…
Q: Job Search Time (Weeks) Q 18 21 14 Older People often…
A: (a) Step-by-step procedure to obtain the mean and the standard deviation using Excel is given below:…
Q: Approximate the measures of center for following GFDT. Data Frequency 30 - 34 2 35 - 39 0 40 - 44…
A: Class 45-49 has the highest frequency i.e. 20. So class Interval 45-49 is the modal class. Here L=…
Q: II. Age f di fal < cf 11-20 5 60 21-30 7 55 Read 31-40 12 48 1) Mean, Median, Mode 2) Quartiles, Q',…
A:
Q: Age in years Frequency 15-19 18 20-24 74 25 - 29 62 30 - 34 26 35-39 20 Total 200 Compute the median…
A: Hello. Since your question has multiple parts, we will solve first question for you. If you want…
Q: Q2: At SQU hospital there is some concern about the high turnover of nurses. A survey was done to…
A: Given that, 2, 5, 7, 8, 8, 11, 12, 14, 20, 23, 23, 25, 26, 27, 28, 29, 31, 36, 36, 42 N=20
Q: Mr Greg distributes numbers of cotton balls to each of his students. His students received the…
A: The data set shows the number of cotton balls to each student received.
Q: Find the following measures of dispersion for the data below: 3 12 19 8 0 6 0 4 10 11 17 18 12 12…
A: Find the following measures of dispersion for the data below: 3,12,19,8,0,6,0,4,10,11,17,18,12…
Q: 21 14 51 16 17 14 16 12 48 0 27 17 32 24 12 10 52 21 26 14 13 24 19 28 26 26 10 21 44 36 22 39 17 17…
A:
Q: Consider the boxplot below. 16 27 45 61 76 10 20 30 40 50 60 70 80 data a. What quarter has the…
A:
Q: Find the following measures of dispersion for the data below: 8 13 8 2 1 8 17 8 13 8 17 11 8 Sorted…
A:
Q: Use the stem-and-leaf plot to list the actual data entries. What's is the maximum data entry? What…
A: From the given plot, the stem value is 10.
Q: 11. Give an example of a set of data that satisfies the following conditions. has 8 data bimodal…
A:
Q: Test 2 H Test 1 0 2 10 12 14 16 18 20 22 24 The interquartile range is larger for test 1 than test…
A: To find if the given options are true or not.
Q: 4. Joshua's academic target is to get his test average in the top half of his Statistics class.…
A: Descriptive statistics can be used for explanatory data analysis purposes. This will give a basic…
Q: Q: NO. 4 :Calculate Mean deviation from Median for the following data. Age 0-10 10-20 20-30 30-40…
A: Given
Q: Treatment N Mean Median Minimum control 60 1.1737 1.1600 .65 3dS 60 1.0043 .9600 .67 6dS 60 .9160…
A: Mean is the average measure of the observation. It is the type of measure of central tendency. It is…
Q: In this study n = 10 brands of wine were measured on a scale 0 – 100 for quality. The price per…
A: Given, ∑i=110Xi=498.3 ; ∑i=110Yi=194.16∑i=110XiYi=10072.137∑i=110Xi2=27237.23 ;…
Q: Government Private Sector Employees Workers 23 25 18 19 34 18 31 22 28 28 33 25 25 21 27 21 32 20 21…
A: The confidence interval are interval range that explains the true value of parameter lies in. It is…
Q: Approximate the measures of center for following GFDT. Data Frequency 12 30 - 34 35 - 39 17 40 - 44…
A: Given, Data Frequency 30-34 12 35-39 17 40-44 14 45-49 0 50-54 2 To find, a) Mean…
Step by step
Solved in 2 steps with 2 images