15. in your treatment, compare the computed F computed (Fc) value from that of Tabular value (5% and 1%), then answer the following questions: a. is the value of Computed Fc is greater than the tabular value in both 5% and 1%? (yes or no) b. is there is any significant differences among the treatment means? (yes or no) c. what is the CV value?
15. in your treatment, compare the computed F computed (Fc) value from that of Tabular value (5% and 1%), then answer the following questions: a. is the value of Computed Fc is greater than the tabular value in both 5% and 1%? (yes or no) b. is there is any significant differences among the treatment means? (yes or no) c. what is the CV value?

Glencoe Algebra 1, Student Edition, 9780079039897, 0079039898, 2018
18th Edition
ISBN:9780079039897
Author:Carter
Publisher:Carter
Chapter10: Statistics
Section10.3: Measures Of Spread
Problem 1GP

Related questions
Question
pls Answer No. 15
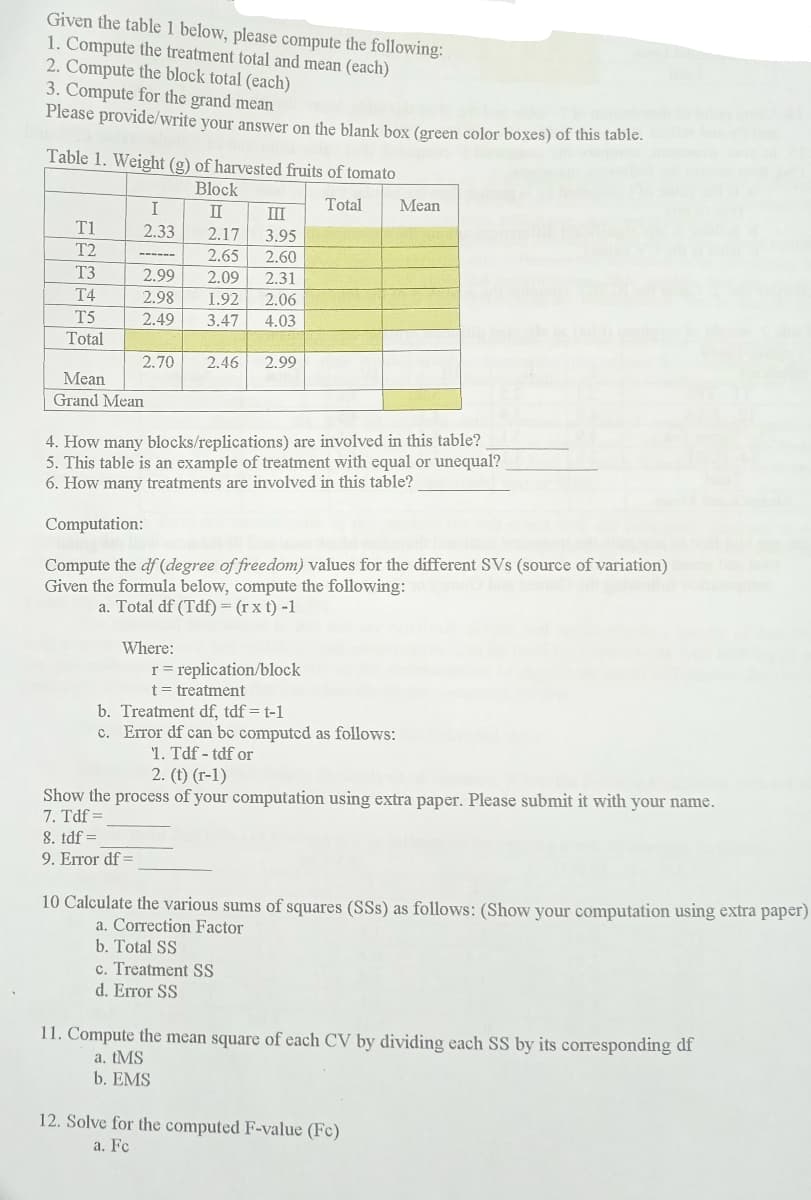
Transcribed Image Text:Given the table 1 below, please compute the following:
1. Compute the treatment total and mean (each)
2. Compute the block total (each)
3. Compute for the grand mean
Please provide/write your answer on the blank box (green color boxes) of this table.
Table 1. Weight (g) of harvested fruits of tomato
Block
I
II
III
Total
Mean
T1
2.33
2.17
3.95
T2
2.65
2.60
-----
T3
2.99
2.09
2.31
T4
2.98
1.92
2.06
T5
2.49
3.47
4.03
Total
2.70
2.46
2.99
Mean
Grand Mean
4. How many blocks/replications) are involved in this table?
This table is an example of treatment with equal or unequal?
6. How many treatments are involved in this table?
Computation:
Compute the df (degree of freedom) values for the different SVs (source of variation)
Given the formula below, compute the following:
a. Total df (Tdf) = (r x t) -1
Where:
r = replication/block
t = treatment
b. Treatment df, tdf = t-1
c. Error df can bc computed as follows:
1. Tdf - tdf or
2. (t) (r-1)
Show the process of your computation using extra paper. Please submit it with your name.
7. Tdf =
8. tdf =
9. Error df =
10 Calculate the various sums of squares (SSs) as follows: (Show your computation using extra paper)
a. Correction Factor
b. Total SS
c. Treatment SS
d. Error SS
11. Compute the mean square of each CV by dividing each SS by its corresponding df
a. tMS
b. EMS
12. Solve for the computed F-value (Fc)
a. Fc
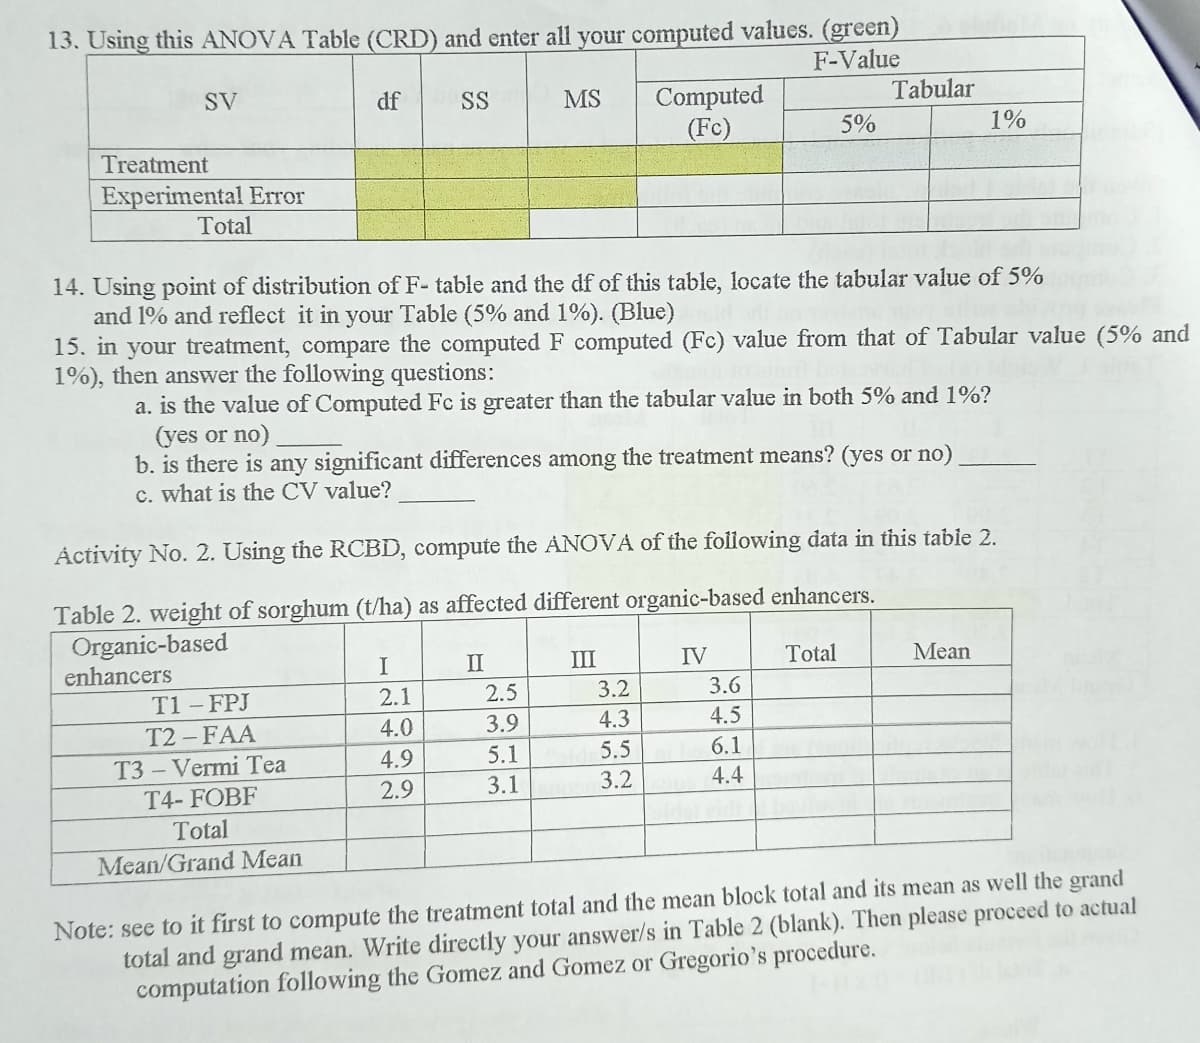
Transcribed Image Text:13. Using this ANOVA Table (CRD) and enter all your computed values. (green)
F-Value
SV
df
SS
Tabular
Computed
(Fc)
MS
5%
1%
Treatment
Experimental Error
Total
14. Using point of distribution of F- table and the df of this table, locate the tabular value of 5%
and 1% and reflect it in your Table (5% and 1%). (Blue)
15. in your treatment, compare the computed F computed (Fc) value from that of Tabular value (5% and
1%), then answer the following questions:
a. is the value of Computed Fc is greater than the tabular value in both 5% and 1%?
(yes or no)
b. is there
c. what is the CV value?
any significant differences among the treatment means? (yes or no)
Activity No. 2. Using the RCBD, compute the ANOVA of the following data in this tabie 2.
Table 2. weight of sorghum (t/ha) as affected different organic-based enhancers.
Organic-based
enhancers
I
II
III
IV
Total
Mean
T1 - FPJ
2.1
2.5
3.2
3.6
T2 – FAA
4.0
3.9
4.3
4.5
T3 - Vermi Tea
4.9
5.1
5.5
6.1
T4- FOBF
2.9
3.1
3.2
4.4
Total
Mean/Grand Mean
Note: see to it first to compute the treatment total and the mean block total and its mean as well the grand
total and grand mean. Write directly your answer/s in Table 2 (blank). Then please proceed to actual
computation following the Gomez and Gomez or Gregorio's procedure.
Expert Solution
This question has been solved!
Explore an expertly crafted, step-by-step solution for a thorough understanding of key concepts.

Step by step
Solved in 4 steps

Recommended textbooks for you
Glencoe Algebra 1, Student Edition, 9780079039897…
Algebra
ISBN:
9780079039897
Author:
Carter
Publisher:
McGraw Hill
Glencoe Algebra 1, Student Edition, 9780079039897…
Algebra
ISBN:
9780079039897
Author:
Carter
Publisher:
McGraw Hill