Can you help me determine the test statistic and P-value of the following equation?

Glencoe Algebra 1, Student Edition, 9780079039897, 0079039898, 2018
18th Edition
ISBN:9780079039897
Author:Carter
Publisher:Carter
Chapter10: Statistics
Section10.4: Distributions Of Data
Problem 19PFA

Related questions
Topic Video
Question
Can you help me determine the test statistic and P-value of the following equation?
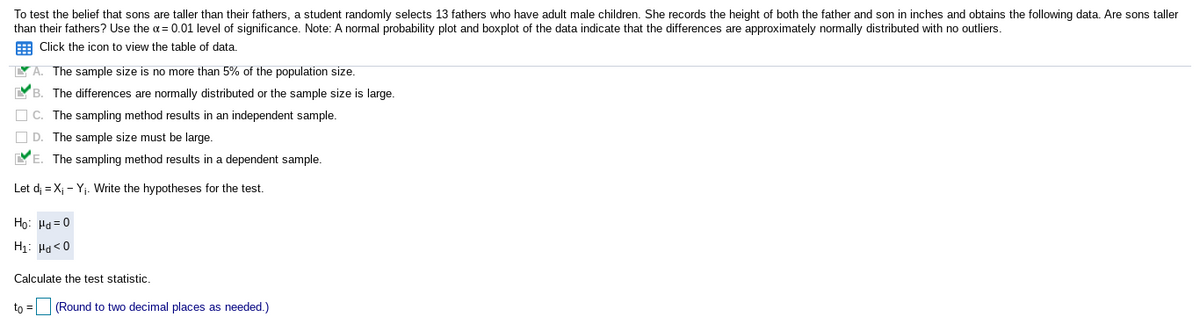
Transcribed Image Text:To test the belief that sons are taller than their fathers, a student randomly selects 13 fathers who have adult male children. She records the height of both the father and son in inches and obtains the following data. Are sons taller
than their fathers? Use the a= 0.01 level of significance. Note: A normal probability plot and boxplot of the data indicate that the differences are approximately normally distributed with no outliers.
E Click the icon to view the table of data.
Y A. The sample size is no more than 5% of the population size.
YB. The differences are normally distributed or the sample size is large.
O C. The sampling method results in an independent sample.
O D. The sample size must be large.
YE. The sampling method results in a dependent sample.
Let d; = X; - Yj. Write the hypotheses for the test.
Ho: Hd = 0
H1: Pa<0
Calculate the test statistic.
to = (Round to two decimal places as needed.)
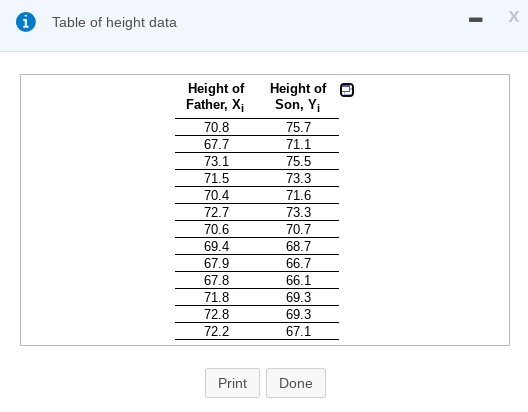
Transcribed Image Text:Table of height data
Height of
Father, Xi
Height of
Son, Yi
70.8
75.7
67.7
71.1
73.1
75.5
71.5
73.3
70.4
71.6
72.7
73.3
70.6
70.7
69.4
68.7
67.9
66.7
67.8
71.8
66.1
69.3
72.8
69.3
72.2
67.1
Print
Done
Expert Solution
This question has been solved!
Explore an expertly crafted, step-by-step solution for a thorough understanding of key concepts.

Step by step
Solved in 3 steps with 1 images

Knowledge Booster


Learn more about
Need a deep-dive on the concept behind this application? Look no further. Learn more about this topic, statistics and related others by exploring similar questions and additional content below.Recommended textbooks for you
Glencoe Algebra 1, Student Edition, 9780079039897…
Algebra
ISBN:
9780079039897
Author:
Carter
Publisher:
McGraw Hill
Glencoe Algebra 1, Student Edition, 9780079039897…
Algebra
ISBN:
9780079039897
Author:
Carter
Publisher:
McGraw Hill