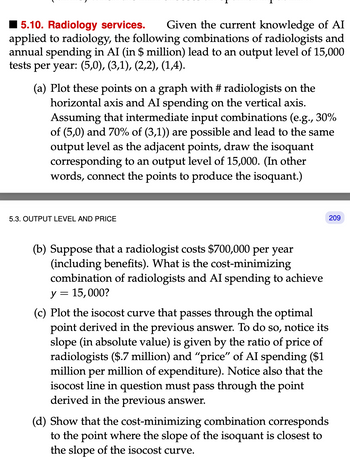
15.10. Radiology services. Given the current knowledge of AI applied to radiology, the following combinations of radiologists and annual spending in AI (in $ million) lead to an output level of 15,000 tests per year: (5,0), (3,1), (2,2), (1,4). (a) Plot these points on a graph with # radiologists on the horizontal axis and AI spending on the vertical axis. Assuming that intermediate input combinations (e.g., 30% of (5,0) and 70% of (3,1)) are possible and lead to the same output level as the adjacent points, draw the isoquant corresponding to an output level of 15,000. (In other words, connect the points to produce the isoquant.) 5.3. OUTPUT LEVEL AND PRICE (b) Suppose that a radiologist costs $700,000 per year (including benefits). What is the cost-minimizing combination of radiologists and AI spending to achieve y = 15,000? (c) Plot the isocost curve that passes through the optimal point derived in the previous answer. To do so, notice its slope (in absolute value) is given by the ratio of price of radiologists ($.7 million) and "price" of AI spending ($1 million per million of expenditure). Notice also that the isocost line in question must pass through the point derived in the previous answer. (d) Show that the cost-minimizing combination corresponds to the point where the slope of the isoquant is closest to the slope of the isocost curve. 200
15.10. Radiology services. Given the current knowledge of AI applied to radiology, the following combinations of radiologists and annual spending in AI (in $ million) lead to an output level of 15,000 tests per year: (5,0), (3,1), (2,2), (1,4). (a) Plot these points on a graph with # radiologists on the horizontal axis and AI spending on the vertical axis. Assuming that intermediate input combinations (e.g., 30% of (5,0) and 70% of (3,1)) are possible and lead to the same output level as the adjacent points, draw the isoquant corresponding to an output level of 15,000. (In other words, connect the points to produce the isoquant.) 5.3. OUTPUT LEVEL AND PRICE (b) Suppose that a radiologist costs $700,000 per year (including benefits). What is the cost-minimizing combination of radiologists and AI spending to achieve y = 15,000? (c) Plot the isocost curve that passes through the optimal point derived in the previous answer. To do so, notice its slope (in absolute value) is given by the ratio of price of radiologists ($.7 million) and "price" of AI spending ($1 million per million of expenditure). Notice also that the isocost line in question must pass through the point derived in the previous answer. (d) Show that the cost-minimizing combination corresponds to the point where the slope of the isoquant is closest to the slope of the isocost curve. 200

Managerial Economics: Applications, Strategies and Tactics (MindTap Course List)
14th Edition
ISBN:9781305506381
Author:James R. McGuigan, R. Charles Moyer, Frederick H.deB. Harris
Publisher:James R. McGuigan, R. Charles Moyer, Frederick H.deB. Harris
Chapter4: Estimating Demand
Section: Chapter Questions
Problem 6E

Related questions
Question
5.10. Hopefully i get a smart expert this time because the last expert did not answer the question and used the excuse that i did not provide enough information when all the information given is in the question. thanks and please explain.
Transcribed Image Text:15.10. Radiology services. Given the current knowledge of AI
applied to radiology, the following combinations of radiologists and
annual spending in AI (in $ million) lead to an output level of 15,000
tests per year: (5,0), (3,1), (2,2), (1,4).
(a) Plot these points on a graph with #radiologists on the
horizontal axis and AI spending on the vertical axis.
Assuming that intermediate input combinations (e.g., 30%
of (5,0) and 70% of (3,1)) are possible and lead to the same
output level as the adjacent points, draw the isoquant
corresponding to an output level of 15,000. (In other
words, connect the points to produce the isoquant.)
5.3. OUTPUT LEVEL AND PRICE
(b) Suppose that a radiologist costs $700,000 per year
(including benefits). What is the cost-minimizing
combination of radiologists and AI spending to achieve
y = 15,000?
209
(c) Plot the isocost curve that passes through the optimal
point derived in the previous answer. To do so, notice its
slope (in absolute value) is given by the ratio of price of
radiologists ($.7 million) and "price" of AI spending ($1
million per million of expenditure). Notice also that the
isocost line in question must pass through the point
derived in the previous answer.
(d) Show that the cost-minimizing combination corresponds
to the point where the slope of the isoquant is closest to
the slope of the isocost curve.
Expert Solution
This question has been solved!
Explore an expertly crafted, step-by-step solution for a thorough understanding of key concepts.

This is a popular solution!

Trending now
This is a popular solution!

Step by step
Solved in 6 steps with 7 images

Knowledge Booster


Learn more about
Need a deep-dive on the concept behind this application? Look no further. Learn more about this topic, economics and related others by exploring similar questions and additional content below.Recommended textbooks for you
Managerial Economics: Applications, Strategies an…
Economics
ISBN:
9781305506381
Author:
James R. McGuigan, R. Charles Moyer, Frederick H.deB. Harris
Publisher:
Cengage Learning


Microeconomics: Principles & Policy
Economics
ISBN:
9781337794992
Author:
William J. Baumol, Alan S. Blinder, John L. Solow
Publisher:
Cengage Learning
Managerial Economics: Applications, Strategies an…
Economics
ISBN:
9781305506381
Author:
James R. McGuigan, R. Charles Moyer, Frederick H.deB. Harris
Publisher:
Cengage Learning
Microeconomics: Principles & Policy
Economics
ISBN:
9781337794992
Author:
William J. Baumol, Alan S. Blinder, John L. Solow
Publisher:
Cengage Learning