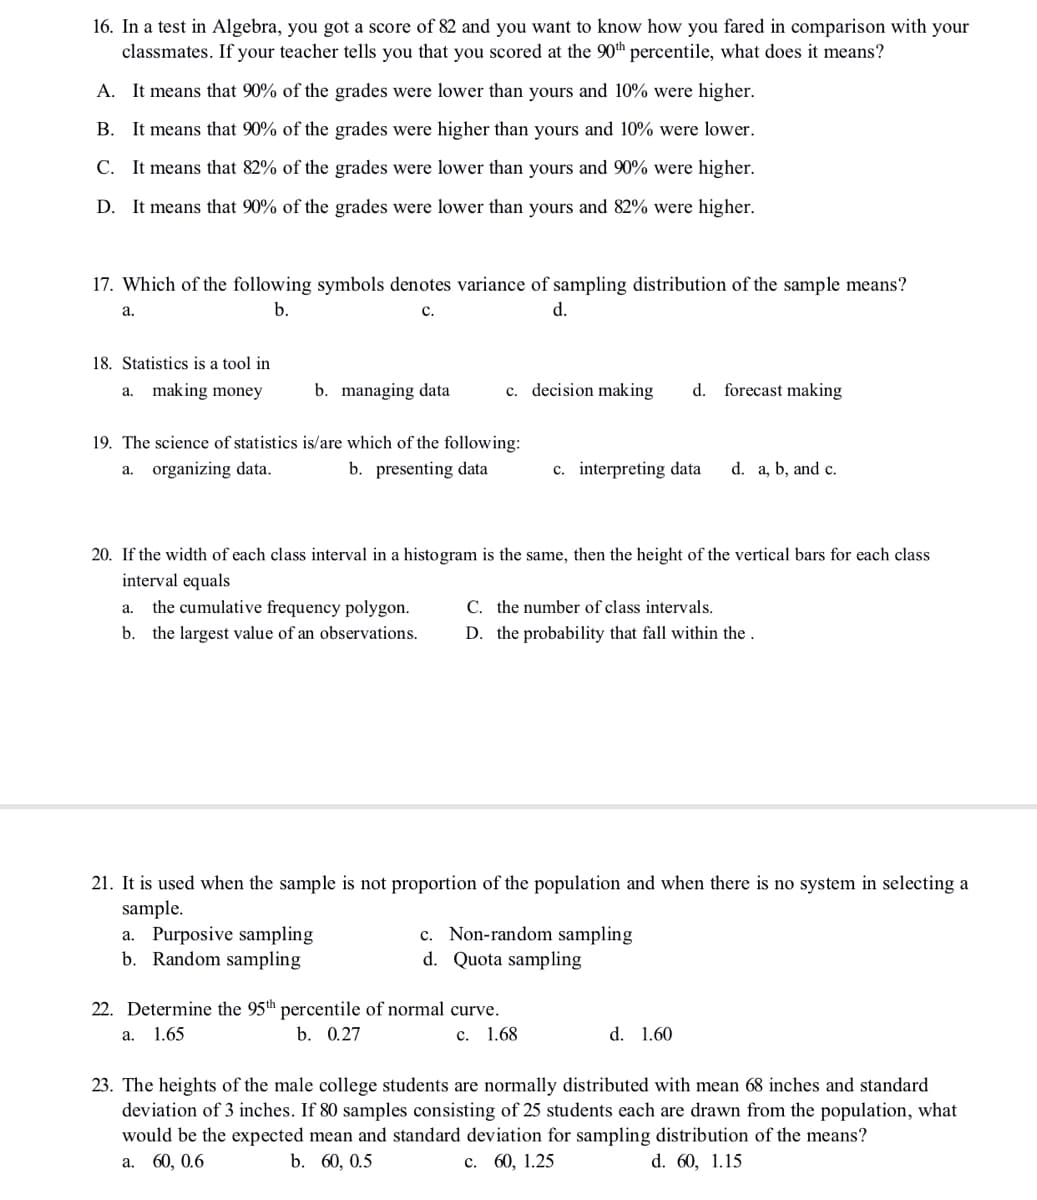
16. In a test in Algebra, you got a score of 82 and you want to know how you fared in comparison with your classmates. If your teacher tells you that you scored at the 90th percentile, what does it means? A. It means that 90% of the grades were lower than yours and 10% were higher. B. It means that 90% of the grades were higher than yours and 10% were lower. C. It means that 82% of the grades were lower than yours and 90% were higher. D. It means that 90% of the grades were lower than yours and 82% were higher.

Glencoe Algebra 1, Student Edition, 9780079039897, 0079039898, 2018
18th Edition
ISBN:9780079039897
Author:Carter
Publisher:Carter
Chapter10: Statistics
Section10.5: Comparing Sets Of Data
Problem 26PFA
icon
Related questions
icon
Concept explainers
Topic Video
Question
100%
16. In a test in Algebra, you got a score of 82 and you want to know how you fared in comparison with your
classmates. If your teacher tells you that you scored at the 90th percentile, what does it means?
A. It means that 90% of the grades were lower than yours and 10% were higher.
B. It means that 90% of the grades were higher than yours and 10% were lower.
C. It means that 82% of the grades were lower than yours and 90% were higher.
D. It means that 90% of the grades were lower than yours and 82% were higher.
17. Which of the following symbols denotes variance of sampling distribution of the sample means?
a.
b.
с.
d.
18. Statistics is a tool in
making money
b. managing data
c. decision making
d. forecast making
a.
19. The science of statistics is/are which of the following:
a. organizing data.
b. presenting data
c. interpreting data
d. a, b, and c.
20. If the width of each class interval in a histogram is the same, then the height of the vertical bars for each class
interval equals
the cumulative frequency polygon.
C. the number of class intervals.
а.
b. the largest value of an observations.
D. the probability that fall within the .
21. It is used when the sample is not proportion of the population and when there is no system in selecting a
sample.
a. Purposive sampling
b. Random sampling
c. Non-random sampling
d. Quota sampling
22. Determine the 95th percentile of normal curve.
a. 1.65
b. 0.27
с. 1.68
d. 1.60
23. The heights of the male college students are normally distributed with mean 68 inches and standard
deviation of 3 inches. If 80 samples consisting of 25 students each are drawn from the population, what
would be the expected mean and standard deviation for sampling distribution of the means?
с. 60, 1.25
а. 60, 0.6
b. 60, 0.5
d. 60, 1.15
Transcribed Image Text:16. In a test in Algebra, you got a score of 82 and you want to know how you fared in comparison with your classmates. If your teacher tells you that you scored at the 90th percentile, what does it means? A. It means that 90% of the grades were lower than yours and 10% were higher. B. It means that 90% of the grades were higher than yours and 10% were lower. C. It means that 82% of the grades were lower than yours and 90% were higher. D. It means that 90% of the grades were lower than yours and 82% were higher. 17. Which of the following symbols denotes variance of sampling distribution of the sample means? a. b. с. d. 18. Statistics is a tool in making money b. managing data c. decision making d. forecast making a. 19. The science of statistics is/are which of the following: a. organizing data. b. presenting data c. interpreting data d. a, b, and c. 20. If the width of each class interval in a histogram is the same, then the height of the vertical bars for each class interval equals the cumulative frequency polygon. C. the number of class intervals. а. b. the largest value of an observations. D. the probability that fall within the . 21. It is used when the sample is not proportion of the population and when there is no system in selecting a sample. a. Purposive sampling b. Random sampling c. Non-random sampling d. Quota sampling 22. Determine the 95th percentile of normal curve. a. 1.65 b. 0.27 с. 1.68 d. 1.60 23. The heights of the male college students are normally distributed with mean 68 inches and standard deviation of 3 inches. If 80 samples consisting of 25 students each are drawn from the population, what would be the expected mean and standard deviation for sampling distribution of the means? с. 60, 1.25 а. 60, 0.6 b. 60, 0.5 d. 60, 1.15
Expert Solution
trending now

Trending now

This is a popular solution!

steps

Step by step

Solved in 3 steps with 1 images

Blurred answer
Knowledge Booster
Centre, Spread, and Shape of a Distribution
Learn more about
Need a deep-dive on the concept behind this application? Look no further. Learn more about this topic, statistics and related others by exploring similar questions and additional content below.
Recommended textbooks for you
Glencoe Algebra 1, Student Edition, 9780079039897…
Algebra
ISBN:
9780079039897
Author:
Carter
Publisher:
McGraw Hill
Big Ideas Math A Bridge To Success Algebra 1: Stu…
Algebra
ISBN:
9781680331141
Author:
HOUGHTON MIFFLIN HARCOURT
Publisher:
Houghton Mifflin Harcourt
Holt Mcdougal Larson Pre-algebra: Student Edition…
Algebra
ISBN:
9780547587776
Author:
HOLT MCDOUGAL
Publisher:
HOLT MCDOUGAL