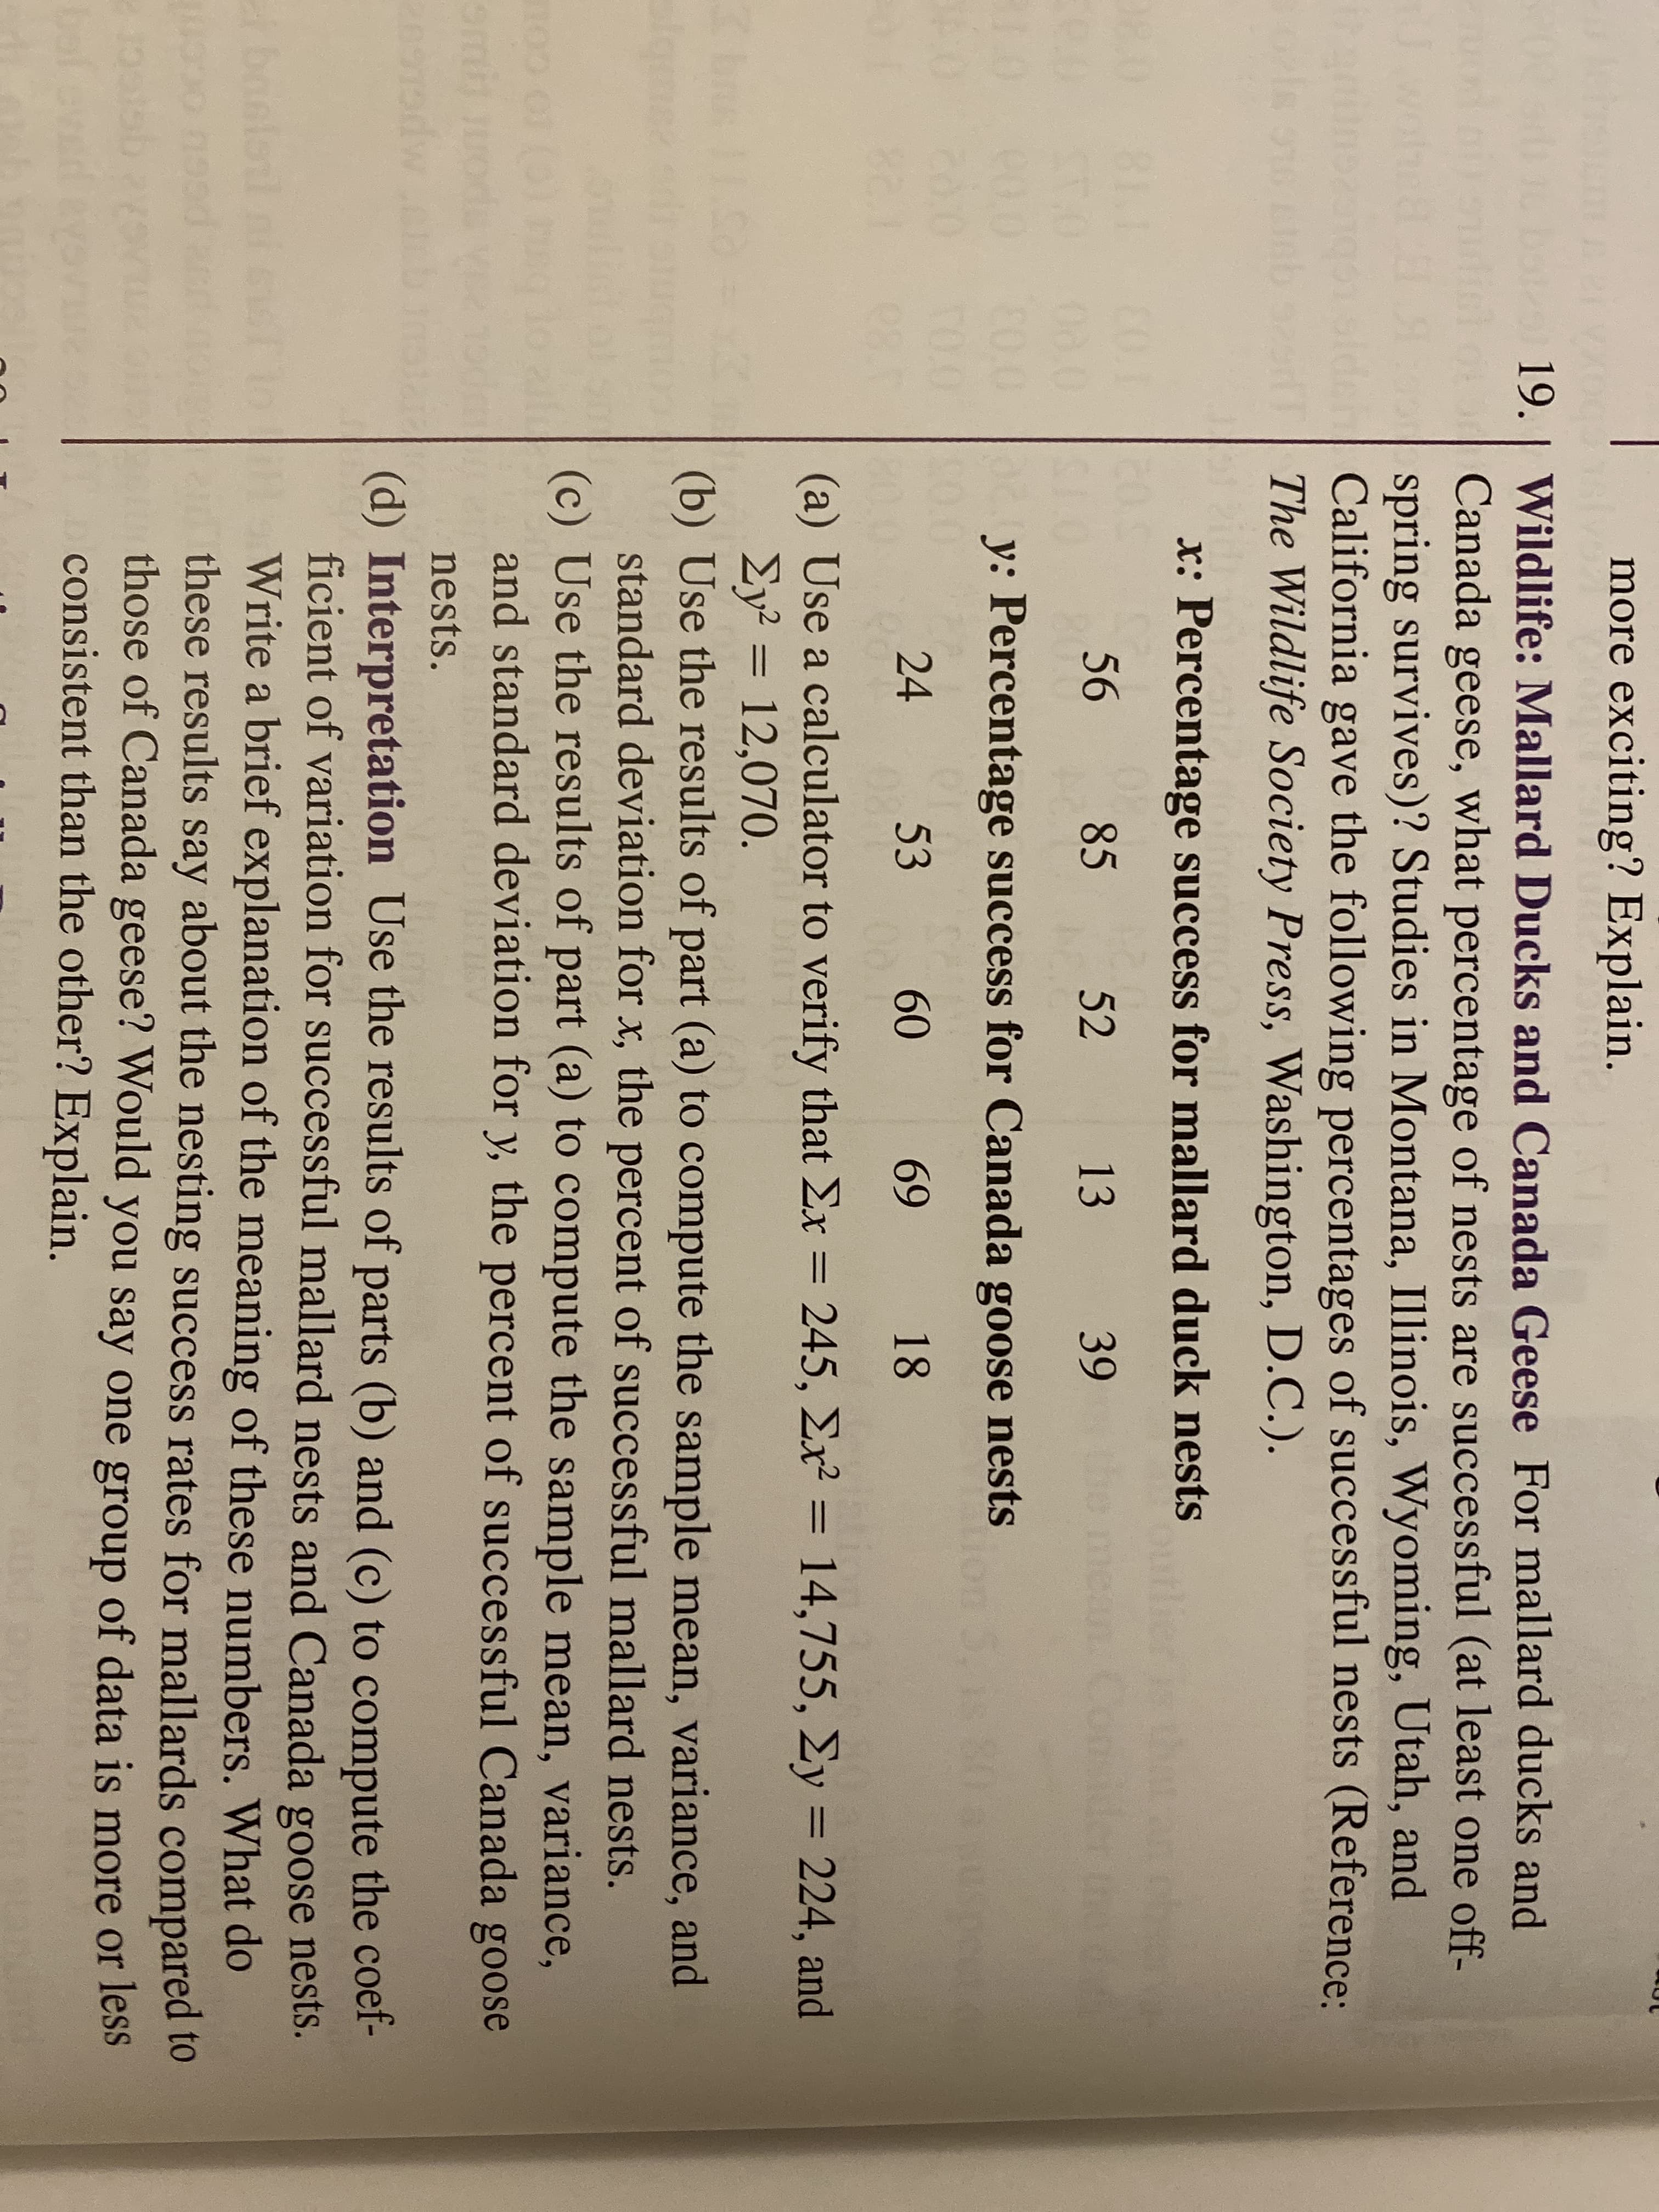
ng 1onmulas to Compute the sămplé variance s- and sample standard deviation s. (e) Suppose the given data comprise the entire population of all x values. Compute the population variance o? and population standard deviation o. 14. | Basic Computation: Coefficient of Variation, Chebyshev Interval Consider sample data with x= = 3. (a) Compute the coefficient of variation. (b) Compute a 75% Chebyshev interval around the sample mean. 15and s %3D %3D Basic Computation: Coefficient of Variation, Chebyshev Interval Consider population data with u (a) Compute the coefficient of variation. (b) Compute an 88.9% Chebyshev interval around the population mean. 15. 20 and o = 2. %3D 16. | Investing: Stocks and Bonds Do bonds reduce the overall risk of an invest- ment portfolio? Let x be a random variable representing annual percent return for Vanguard Total Stock Index (all stocks). Let y be a random variabl representing annual return for Vanguard Balanced Index (60% stock and 40% bian bond). For the past several years, we have the following data (Reference: Morningstar Research Group, Chicago): more exciting? Explain. 19. | Wildlife: Mallard Ducks and Canada Geese For mallard ducks and Canada geese, what percentage of nests are successful (at least one off- spring survives)? Studies in Montana, Illinois, Wyoming, Utah, and Iden California gave the following percentages of successful nests (Reference: orls nb The Wildlife Society Press, Washington, D.C.). x: Percentage success for mallard duck nests dier s an 56 85 52 13 39 00.0 E0.0 T0.0 e0.0 y: Percentage success for Canada goose nests 5.1s s 80 Kuspect 24 53 60 69 18 (a) Use a calculator to verify that Ex = 245, Ex² = 14,755, Ey = 224, and Ey = 12,070. (b) Use the results of part (a) to compute the sample mean, variance, and standard deviation for x, the percent of successful mallard nests. (c) Use the results of part (a) to compute the sample mean, variance, and standard deviation for y, the percent of successful Canada goose %3D Jqmerd omi uod nests. (d) Interpretation Use the results of parts (b) and (c) to compute the coef- ficient of variation for successful mallard nests and Canada goose nests. Write a brief explanation of the meaning of these numbers. What do these results say about the nesting success rates for mallards compared to those of Canada geese? Would you say one group of data is more or less consistent than the other? Explain. boolsn bol


Percentage
A percentage is a number indicated as a fraction of 100. It is a dimensionless number often expressed using the symbol %.
Algebraic Expressions
In mathematics, an algebraic expression consists of constant(s), variable(s), and mathematical operators. It is made up of terms.
Numbers
Numbers are some measures used for counting. They can be compared one with another to know its position in the number line and determine which one is greater or lesser than the other.
Subtraction
Before we begin to understand the subtraction of algebraic expressions, we need to list out a few things that form the basis of algebra.
Addition
Before we begin to understand the addition of algebraic expressions, we need to list out a few things that form the basis of algebra.
14,15 and 19


Trending now
This is a popular solution!

Step by step
Solved in 3 steps with 2 images


