17 In a bell-shaped data set with p = 15 and o = 5, approximately 95% of the data will .be between 10 and 20. %3D
17 In a bell-shaped data set with p = 15 and o = 5, approximately 95% of the data will .be between 10 and 20. %3D

Glencoe Algebra 1, Student Edition, 9780079039897, 0079039898, 2018
18th Edition
ISBN:9780079039897
Author:Carter
Publisher:Carter
Chapter10: Statistics
Section10.4: Distributions Of Data
Problem 19PFA

Related questions

Question
100%
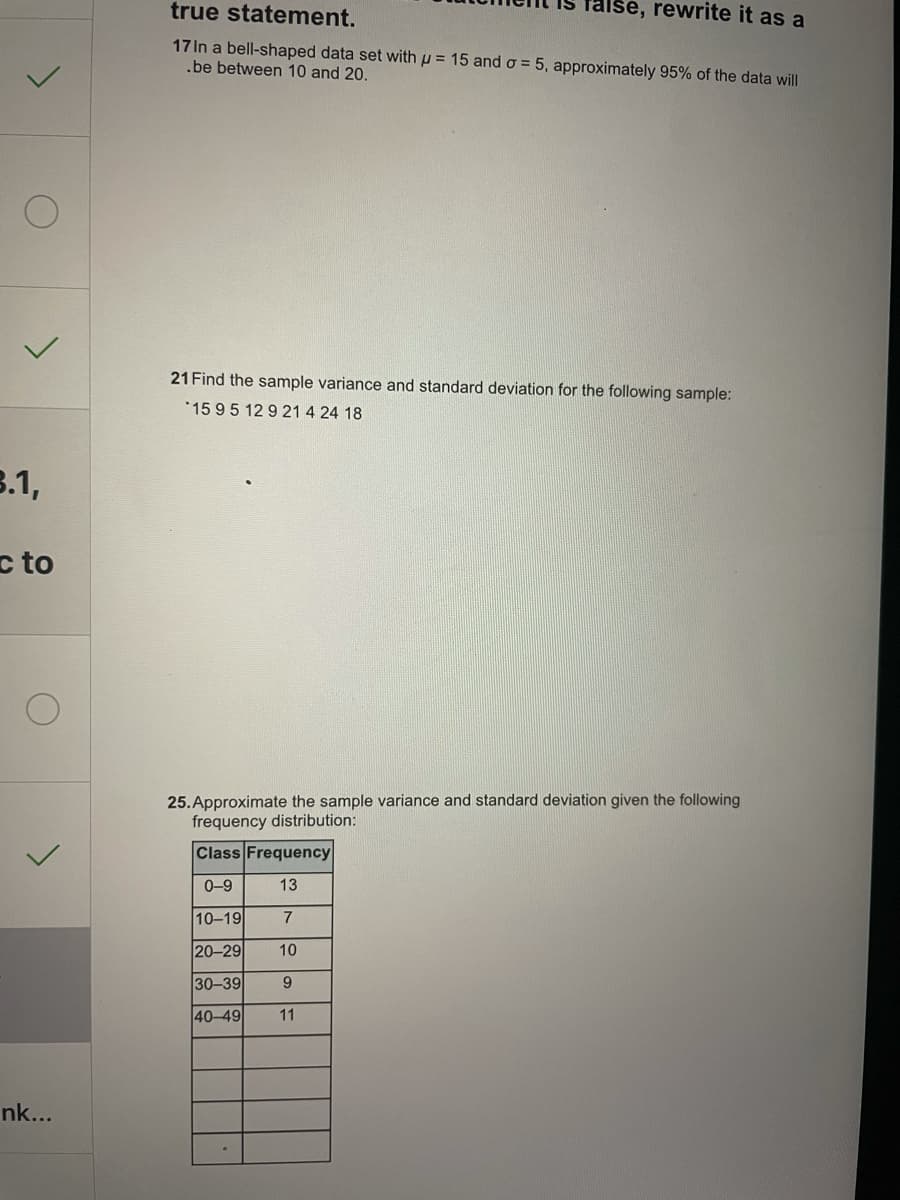
Transcribed Image Text:true statement.
false, rewrite it as a
17 In a bell-shaped data set with p = 15 ando = 5, approximately 95% of the data will
.be between 10 and 20.
21 Find the sample variance and standard deviation for the following sample:
*1595 12 9 21 4 24 18
3.1,
c to
25. Approximate the sample variance and standard deviation given the following
frequency distribution:
Class Frequency
0-9
13
10-19
7
20-29
10
30-39
9.
40-49
11
nk...
Transcribed Image Text:o the Course
with Your
all 2021
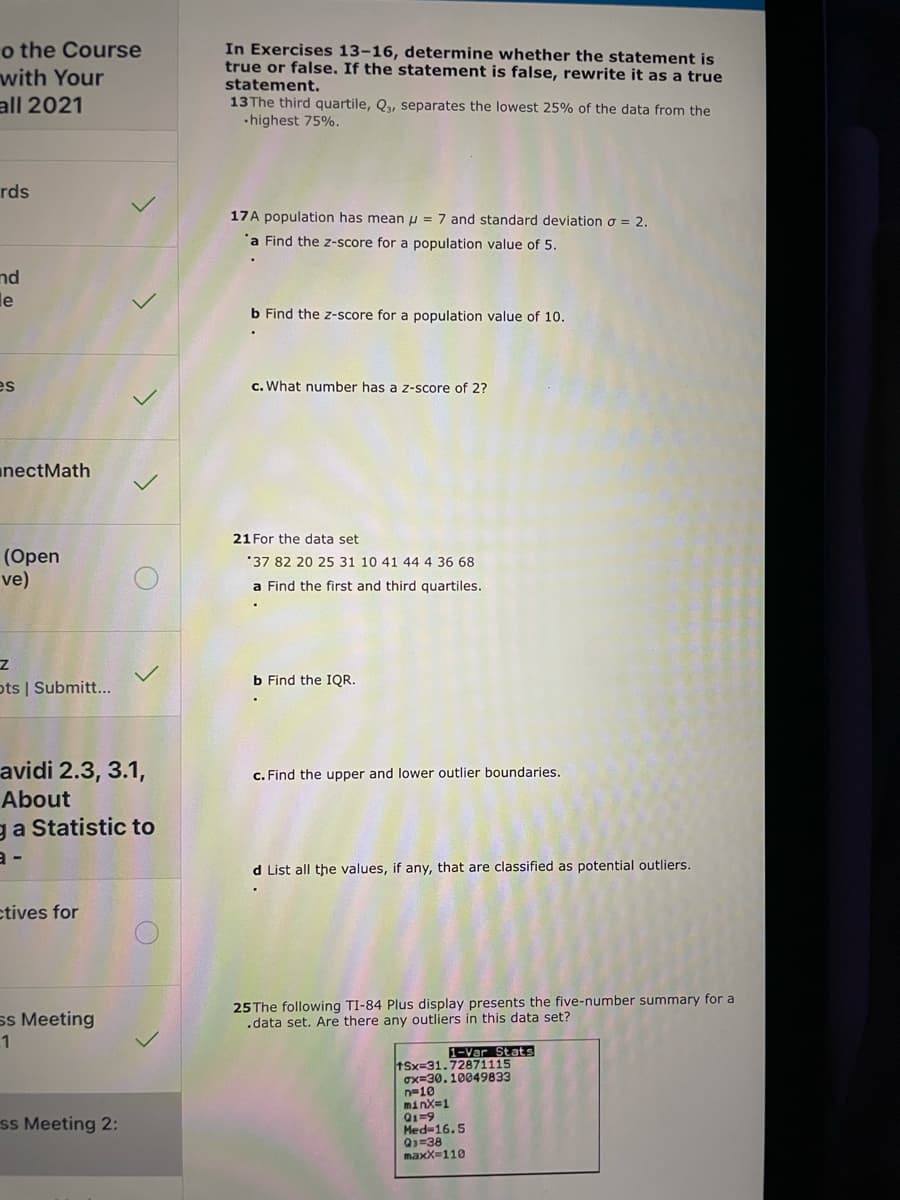
In Exercises 13-16, determine whether the statement is
true or false. If the statement is false, rewrite it as a true
statement.
13The third quartile, Qu separates the lowest 25% of the data from the
•highest 75%.
rds
17A population has mean u = 7 and standard deviation o = 2.
'a Find the z-score for a population value of 5.
nd
le
b Find the z-score for a population value of 10.
es
c. What number has a z-score of 2?
nectMath
21 For the data set
(Open
ve)
'37 82 20 25 31 10 41 44 4 36 68
a Find the first and third quartiles.
b Find the IQR.
ots | Submitt...
avidi 2.3, 3.1,
About
c. Find the upper and lower outlier boundaries.
ga Statistic to
d List all the values, if any, that are classified as potential outliers.
ctives for
ss Meeting
25The following TI-84 Plus display presents the five-number summary for a
.data set. Are there any outliers in this data set?
1
1-Var Stats
tSx-31.72871115
gx=30. 10049833
n=10
minx=1
Q1=9
Med-16.5
Q1=38
maxX-110
ss Meeting 2:
Expert Solution
This question has been solved!
Explore an expertly crafted, step-by-step solution for a thorough understanding of key concepts.

This is a popular solution!

Trending now
This is a popular solution!

Step by step
Solved in 2 steps

Knowledge Booster


Learn more about
Need a deep-dive on the concept behind this application? Look no further. Learn more about this topic, statistics and related others by exploring similar questions and additional content below.Recommended textbooks for you
Glencoe Algebra 1, Student Edition, 9780079039897…
Algebra
ISBN:
9780079039897
Author:
Carter
Publisher:
McGraw Hill
Glencoe Algebra 1, Student Edition, 9780079039897…
Algebra
ISBN:
9780079039897
Author:
Carter
Publisher:
McGraw Hill