7. Which of the above plots (A-D) best depicts the data?
Q: State whether each line or curve of best fit is a good model for the data. Justify your answer. a)…
A: The line or curve is considered to be best fit if most of the data points lie on the line (or curve)…
Q: Suppose automobile insurance companies gave annual premiums for top-rated companies in several…
A:
Q: 3. What could be the approximate value of the corelation coefficient for the accompanying scatter…
A: 3. It is clear that the data points are closer to each other and also observed that as the values of…
Q: The variance of the data :. 6 ,6 ,-6,-6 is equal to
A: Find variance of the data 6 ,6 ,-6,-6
Q: 3. If the median of the data set x, i ..n? the data set 2x+3. i 1, 1..n, is 10, what is the median…
A:
Q: B. You were tasked to present the data using a scatter plot for the study conducted which involves…
A: Given: Number of hours studying Exam score 2 56 4.5 45 5 92 5 73 6 62 3 68 10 87…
Q: Create a box plot for the data given. 1, 4, 9, 16, 25
A: A boxplot is determined by plotting value of Minimum, First quartile(Q1), Second Quartile or…
Q: (a) Find the five-number summary, and (b) draw a box-and-whisker plot of the data. 3 8 8 6 2 9 8 7 9…
A: Calculate five point summary ,Box and Whisker Plots from the following…
Q: 1. Find the slope of the median-median line for the dataset. y 3. 4 4 1.
A:
Q: What is the median of the data shown on the dot plot? ::::::. 1 2 3 4 5 6 7 8 9 10 3 04 05 06
A: In this question we have to prove the median of the data shown on the dot plot. we know that, If the…
Q: Use the below dot plot to answer questions 1-4. In game one of a high school basketball playoff, the…
A: Given The dot plot is as follows:
Q: Here is the 5 Number Summary for a set of data: 0.0 6 15 23 80…
A: Question based on box plot.
Q: 3- Listed below are the selling prices (in thousands of dollars) of a sample of 20 vehicles sold by…
A: Dot Plot: The dot plot also known as the strip plot or dot chart, by using this dot plot we can…
Q: a. Construct a stem-and -leaf display of the data. What is the range of the data? b. What proportion…
A: Here use ascending order of data for making stem leaf plot In leaf last digit only represented
Q: If you are constructing a box plot, what is the value that is at the upper end of the "box?"
A: Here given 5 point summary 18,19,20,21,45
Q: Here is the 5 Number Summary for a set of data: 8 10.5 14 20.7 55 If you are constructing a box…
A: Given: Data 8 10.5 14 20.7 55
Q: The number of home runs hit by both Babe Ruth and Hank Aaron in each season of their careers is…
A: 5) A careful inspection of side-by-side box plot reveals that the median of Babe Ruth (approx. 40)is…
Q: a 12.5 Q16 For the folloning Bos Plot, The (largest, median, smallest ) va 30 40 (40.30,60) b)…
A: Note: Hi, thank you for the question. As per our company guideline we are supposed to answer only…
Q: (a) You are given two identical sets of data A and B with the largest value from the data set B…
A: This is what a box and whsker plot looks like.
Q: Which value of r would be appropriate for the scatter plot shown?
A: here use given scatter plot
Q: 24. Windy In the last chapter, we looked at three outliers arising from a plot of Average Wind Speed…
A: Given: February June August Mean 2.324 0.857 0.63 SD 1.577 0.795 0.597 Outliers (x) 6.73…
Q: Consider the following Normal Plot. How would you go about determining the setting of A and B to…
A: When all the effects are zero, the normal probability plot of the effects tell about the…
Q: Make a stem and leaf plot of the data. B) how many of the measurements are greater than 40? C)…
A: Since you have asked multiple question, we will solve the first question for you. If youwant any…
Q: 1
A: First I want to convert dot plot in data. X frequency (f) 0 4 1 3 2 5 3 2
Q: If all the plots on a scatter diagram lie on a straight line, what is the standard error of…
A: Scatter diagram: It is a tool for analyzing the correlation between the dependent variable and…
Q: Which of the following is NOT true about box plots?
A: here use box plot properties to answer the question
Q: Which of the following dot plots represent the data below? Hours Slept 6. 8 7 5 6 5 7 7 10 7
A:
Q: Here is the 5 Number Summary for a set of data: 1.55 2.8 3 3.44 3.93…
A: The five number summary for a set of data is 1.55, 2.8, 3, 3,44 and 3.93.
Q: Which box-and-whisker plot best represents the data show belov 41, 42, 47, 60, 62, 65, 69, 76, 87
A: For given data, Population size: 9Median: 62Minimum: 41Maximum: 87First quartile: 44.5Third…
Q: ighly skewe
A: Effects of skewed data: Degrades the model’s ability (especially regression based models) to…
Q: You get a data about the "mean household income" for your city, and decide to display it…
A: The variable of interest is " mean household income".
Q: Which of the following sets of data applies to this box-and-whisker plot? -4 -3 -2 -1 0 1 2 3 4 5
A: Boxplot: Boxplot is the simple way to plot the observations of the distribution, with five-number…
Q: 23. What observations you make from these plots?
A: After comparing all the four graphs here, we can say that first three graphs have a similar…
Q: Which equation is the best fit for the data in the table? * Y 3 2 12 5 27 8 48 11 O…
A:
Q: The following scatter plot represents the height of a basketball in seconds during a free throw…
A: 2. (a). The given scatter plot image resembles a downwards opening parabola which is the graph of a…
Q: Which is the line of best fit for the data shown in the table?
A:
Q: The table below shows data for stuffed animals sold at a zoo gift shop. If the data were represented…
A:
Q: 4- The fuel tank capacity in gallons and the cruising range is given for 6 SUV's. a. Develop a…
A: (a) Use EXCEL to construct the scatter plot. EXCEL procedure: Go to EXCEL Go to Insert menu…
Q: Consider the following Box plot so our data set a and data set B. Which data set has the largest…
A: We have given that Two Box plot boxplot for data set A and boxplot for data set B We have to…
Q: dear sir mam how do u create a steam and leaf data plot
A: Stem-and-leaf plot:A graphical representation of the quantitative data in which each data entry is…
Q: Which statement is true about the dot plot? 2 3 4 5 O The data is fairly uniform. O The mean is…
A: We have to find the answer
Q: Consider the following ordered data. 2 5 5 6 7 7 8 9 10 Find the low, Q1, median,…
A:
Q: 40 Which of the following information is NOT true about a box plot? *
A: Here use box plot representation of left ,right and symmetric distribution
Q: What is the shape of the distribution for both plots? This graph was from excel.
A: Given that Two box plot are given one in blue color and other is red color
Q: Find the five number summary and draw a box and whisker plot of the data. 4 8 8 6 2 9 8 7 9 6 9 4 2…
A: We want to find 5 number summary
Q: Consider the GPA of students in class:…
A: Given data, Consider the GPA of students in class:…
Q: Stem-and-leaf plots have two parts. O True O False
A: The given statement is stem-and-leaf plots have two parts.
Q: 2. Which type of plot would be most useful for visualizing the relationship between Age and job…
A: From the above information Option d is correct d. Scatter plot
Q: To compare the students performance in a morming time math exam and in an evening time exam; the…
A: Given boxplots are :
Q: The two dot plots below compare the forearm lengths of two groups of schoolchildren: Forearm Length,…
A:
need it fast, do number 7
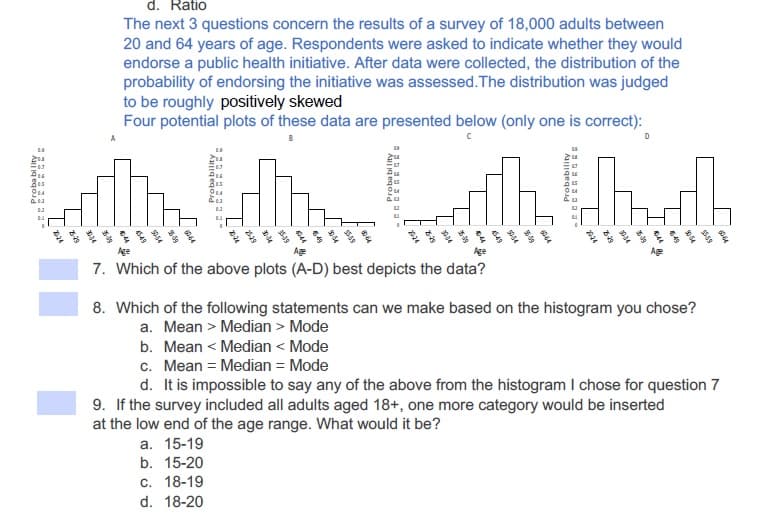
Trending now
This is a popular solution!
Step by step
Solved in 2 steps