17. For the following set of scores: Scores: 5 8 5 7 6 6 5 7 4 6 6 9 5 5 4 6 7 5 7 5 a. Place the scores in a frequency distribution table. b. Identify the shape of the distribution.
17. For the following set of scores: Scores: 5 8 5 7 6 6 5 7 4 6 6 9 5 5 4 6 7 5 7 5 a. Place the scores in a frequency distribution table. b. Identify the shape of the distribution.

Glencoe Algebra 1, Student Edition, 9780079039897, 0079039898, 2018
18th Edition
ISBN:9780079039897
Author:Carter
Publisher:Carter
Chapter10: Statistics
Section10.4: Distributions Of Data
Problem 19PFA

Related questions
Question
100%
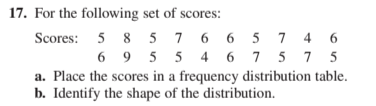
Transcribed Image Text:17. For the following set of scores:
Scores: 5 8 5 7 6 6 5 7 4 6
6 9 5 5 4 6 7 5 7 5
a. Place the scores in a frequency distribution table.
b. Identify the shape of the distribution.
Expert Solution
This question has been solved!
Explore an expertly crafted, step-by-step solution for a thorough understanding of key concepts.

This is a popular solution!

Trending now
This is a popular solution!

Step by step
Solved in 2 steps with 2 images

Recommended textbooks for you
Glencoe Algebra 1, Student Edition, 9780079039897…
Algebra
ISBN:
9780079039897
Author:
Carter
Publisher:
McGraw Hill
Glencoe Algebra 1, Student Edition, 9780079039897…
Algebra
ISBN:
9780079039897
Author:
Carter
Publisher:
McGraw Hill