III. The data represent the ages of Presidents at the time they were first inaugurated. 57 61 57 57 58 57 61 54 68 51 49 64 50 48 65 52 56 46 54 49 51 47 55 55 54 42 51 56 55 51 54 51 60 62 43 55 56 61 52 69 64 46 54 47 a) Were the data obtained from a population or a sample? Explain your answer. b) How is the above might have been collected? Explain the reason for your answer c) Construct a frequency distribution for the data. (Use your own judgment as to the number of classes and class size.) d) Use excel or SPSS software to generate a sound Histogram. e) Using the histogram generated in (F) manually draw frequeney polygon and cumulative frequency distribution f) What was the age of the oldest President? g) What was the age of the youngest President? h) According to your opinion state a graphical representation method for the above data that would be inappropriate. State the reason why you consider it to be inappropriate.
III. The data represent the ages of Presidents at the time they were first inaugurated. 57 61 57 57 58 57 61 54 68 51 49 64 50 48 65 52 56 46 54 49 51 47 55 55 54 42 51 56 55 51 54 51 60 62 43 55 56 61 52 69 64 46 54 47 a) Were the data obtained from a population or a sample? Explain your answer. b) How is the above might have been collected? Explain the reason for your answer c) Construct a frequency distribution for the data. (Use your own judgment as to the number of classes and class size.) d) Use excel or SPSS software to generate a sound Histogram. e) Using the histogram generated in (F) manually draw frequeney polygon and cumulative frequency distribution f) What was the age of the oldest President? g) What was the age of the youngest President? h) According to your opinion state a graphical representation method for the above data that would be inappropriate. State the reason why you consider it to be inappropriate.

Holt Mcdougal Larson Pre-algebra: Student Edition 2012
1st Edition
ISBN:9780547587776
Author:HOLT MCDOUGAL
Publisher:HOLT MCDOUGAL
Chapter11: Data Analysis And Probability
Section11.4: Collecting Data
Problem 3E

Related questions
Question
Dear Tutor,
I need answers for question D,E AND F
Transcribed Image Text:Higher Nationals
P Pearson I BTEC
III.
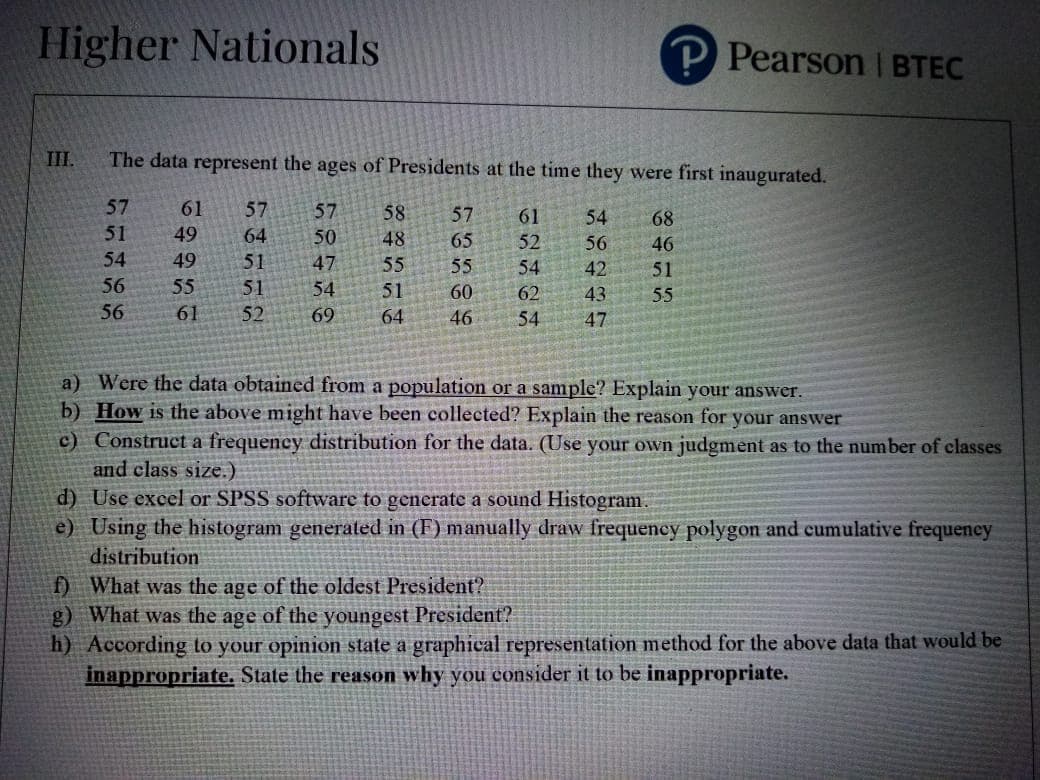
The data represent the ages of Presidents at the time they were first inaugurated.
57
61
57
57
58
57
61
54
68
51
49
64
50
48
65
52
56
46
54
49
51
47
55
55
54
42
51
56
55
51
54
51
60
62
43
55
56
61
52
69
64
46
54
47
a) Were the data obtained from a population or a sample? Explain your answer.
b) How is the above might have been collected? Explain the reason for your answer
c) Construct a frequency distribution for the data. (Use your own judgment as to the number of classes
and class size.)
d) Use excel or SPSS software to generate a sound Histogram
e) Using the histogram generated in (F) manually draw frequeney polygon and cumulative frequency
distribution
f) What was the age of the oldest President?
g) What was the age of the youngest President?
h) According to your opinion state a graphical representation method for the above data that would be
inappropriate. State the reason why you consider it to be inappropriate.
Expert Solution
This question has been solved!
Explore an expertly crafted, step-by-step solution for a thorough understanding of key concepts.

This is a popular solution!

Trending now
This is a popular solution!

Step by step
Solved in 6 steps with 3 images

Recommended textbooks for you
Holt Mcdougal Larson Pre-algebra: Student Edition…
Algebra
ISBN:
9780547587776
Author:
HOLT MCDOUGAL
Publisher:
HOLT MCDOUGAL

College Algebra (MindTap Course List)
Algebra
ISBN:
9781305652231
Author:
R. David Gustafson, Jeff Hughes
Publisher:
Cengage Learning

Holt Mcdougal Larson Pre-algebra: Student Edition…
Algebra
ISBN:
9780547587776
Author:
HOLT MCDOUGAL
Publisher:
HOLT MCDOUGAL
College Algebra (MindTap Course List)
Algebra
ISBN:
9781305652231
Author:
R. David Gustafson, Jeff Hughes
Publisher:
Cengage Learning