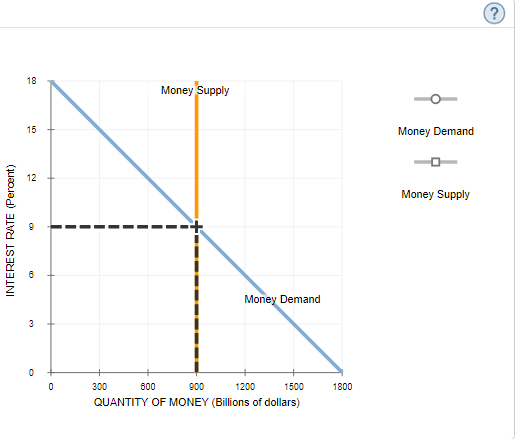
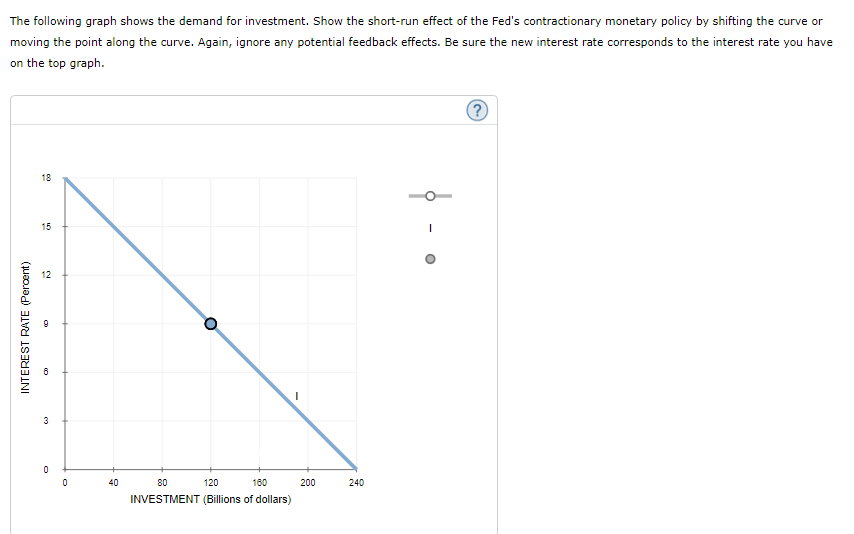
(? 18 Money Supply 15 Money Demand 12 Money Supply Money Demand 300 600 900 1200 1500 1800 QUANTITY OF MONEY (Billions of dollars) INTEREST RATE (Percent) The following graph shows the demand for investment. Show the short-run effect of the Fed's contractionary monetary policy by shifting the curve or moving the point along the curve. Again, ignore any potential feedback effects. Be sure the new interest rate corresponds to the interest rate you have on the top graph. 18 15 12 40 80 120 180 200 240 INVESTMENT (Billions of dollars) INTEREST RATE (Percent)


Monetary Policy and Equation of Exchange
The monetary policy has been defined as the policy that is used by the Federal Reserve (the central bank of the US) or the central bank (the central bank of India is RBI) along with the use of the supply of money to accomplish certain macroeconomic policies. Monetary policy is a supply-side macroeconomic policy that supervises the growth rate and money supply in the economy.
Monetary Economics
As from the name, it is very evident that monetary economics deals with the monetary theory of economics. Therefore, we can say that monetary economics, is that part of economics that provides us with the idea or notion of analyzing money as a holding with its function, which acts as the medium of exchange, the store of value through which the buying and selling are done and also the unit of account. It also helps in formulating the framework of the monetary policy of a bank in an economy which ultimately results in the welfare of the people residing in that particular economy. The monetary policy of an economy also helps to analyze and evaluate the financial health of it.


Trending now
This is a popular solution!

Step by step
Solved in 2 steps with 2 images


