18. What is the value of Sum of Products (SP)? (SHOW YOUR WORK)
Q: estion 1: Let X beta(a, 1). Find the distribution of- log(X). Hint: Use the fact that I'(a+1) =…
A: Solution
Q: Test the hypothesis using the P-value approach. Be sure to verify the requirements of the test. Hg:…
A:
Q: Suppose a researcher is testing the hypothesis Hn: p=0.6 versus H,: p<0.6 and she finds the P-value…
A: The random variable X follows normal distribution. We have to test whether the population proportion…
Q: Out of 409 applicants for a job, 237 have over 10 years of experience and 112 have over 10years of…
A: Given Out of 409 applicants for a job, 237 have over 10 years of experience and 112 have over…
Q: You want to obtain a sample to estimate a population proportion. Based on previous evidence, you…
A:
Q: Activity: Sketch and Locate Locating test statistic: (a) Draw the normal curve. (b) Locate the given…
A: Each hypothesis has two tail, they are one tail and two tail. Every normal curve has two region,…
Q: The lifetime of a type of battery, in hours, from a sample provided by a manufacturer is as follows…
A: For the given sample, The sample variance is, s^2=8.4889 and the sample standard deviation is…
Q: 6. In year 2022 a random sample of 35 households in Ottawa found that the average annual internet…
A: The random variable annual internet service cost per household follows normal distribution. We have…
Q: Find the area of the shaded region under the standard normal distribution to the left of the given…
A:
Q: political candidate has asked you to conduct a poll to determine what percentage of people support…
A: Given that Margin of error =E =0.002 99%confidence level.
Q: What is the population parameter? Pick What is the point estimate for the population proportion? p =…
A: We have given that Favourable cases(Hispanic/Latino), X = 68 Sample size, n = 400 Confidence level…
Q: Find the probability and draw the probability mass function of the following. The probability that a…
A: Solution
Q: A ball is drawn randomly from a jar that contains 2 red balls, 7 white balls, and 4 yellow balls.…
A: 13 balls =2(red balls)+7(white ball)+4(yellow balls)
Q: The manufacturer of running shoes conducted a study on its newly developed jogging shoe. Listed are…
A: Given that Types of nonconformity Count Heel separation 92 Sole penetration 62 Sole…
Q: Test the hypothesis using the P-value approach. Be sure to verify the requirements of the test. Hg:…
A:
Q: A researcher wishes to determine whether the blood pressure of vegetarians is, on average, lower…
A:
Q: A random sample of 250 bolts from machine A contained 25 defective bolts, while an independently…
A: GivenFor Machine Asample size(n1)=250x1=25p1^=x1n1=25250=0.10For Machine Bsample…
Q: company that manufactures batteries used in electric cars is reporting that their newest model of…
A: Given Population mean μ=15, n=sample size=62, sample mean x̄=13.9, population standard deviations…
Q: Calculate the probability (as a percent) of the following 7-card hand: AAABBCC (three cards of the…
A: Let us suppose there are three marbles viz. a red, a green and a blue. From these, there are three…
Q: D1) ) A fair die is rolled 60 times, and the value of chi-square is computed using expected counts…
A: A fair die is rolled 60 times Expected counts=10 for each face the shape of the distribution of…
Q: Compute the following. (a) P6, 2. (b) C6, 2. (c) P6, 6.
A: P(n,r)=n!n-r!C(n,r)=n!n-r!.r!
Q: Draw and calculate the area under the standard normal curve to the left of these values: a. z= 1.6…
A: We will use the Standard Normal table to find the required areas.
Q: 9.24 Let Y1, Y2, Y3, ... Y, be independent standard normal random variables. a What is the…
A: Given that Let Y₁, Y₂, Y3,... Yn be independent standard normal random variables. Using this…
Q: Determine whether the claim stated below represents the null hypothesis or the alternative…
A:
Q: Answer the following questions about probability and statistics. A. What is P(X = 5) when X ~…
A: Given that. X~N( 5 ,25 ) X~N( 0 , 1 ) μ=0 , ?=1 (for standard normal distribution)…
Q: In 1945, an organization asked 1414 randomly sampled American citizens, "Do you think we can develop…
A: Given data number of success , x= 753 sample size, n =1414 population proportion,p= 0.5…
Q: a. What is the distribution of X? X - N( b. What is the distribution of x? ¤ ~ N( c. What is the…
A: Given that Mean=11 , Standard deviation=1.1 Sample size=10 Note: According to bartleby experts…
Q: The amount of sugar in a Krispy Kream glazed donut is 10 g. Many people feel that cereal is a…
A: Given that Observation: XX X^2X2 1 10 100 2 14 196 3 12 144 4 9 81 5 13 169 6 13 169…
Q: Critical values for quick reference during this activity. Confidence level Critical value 0.90 2* -…
A: Given that X=190 , n=1000
Q: According to a study, the salaries of registered nurse are normally distributed with a mean of 56310…
A: Given,mean(μ)=56310standard deviation(σ)=5038
Q: A consumer group is investigating a producer of diet meals to examine if its prepackaged meals…
A: The random variable advertised amount of protein follows normal distribution. We have to test…
Q: Determine the point estimate of the population proportion, the margin of error for the following…
A: It is given that Confidence interval : (0.097, 0.323) Sample size n = 1500 Let p denote the point…
Q: Which one of the following statements is false? To compute r, the form of the relationship should…
A: We know that the 1) r, the correlation coefficient between two or more variable measure the linear…
Q: 1. Due to the increasing cases of malnutrition among toddlers in a certain barangay, a group of…
A: when we have a situation like we have to test the hypothesis like in before and after situation we…
Q: 71% of all Americans are home owners. If 32 Americans are randomly selected, find the probability…
A: Givenp=0.71n=32Let "x" be no.of them are home ownersx~Binomial(n=32,p=0.71)P(X=x)=(nx)×px×(1-p)n-x…
Q: A simple random sample of size n = 16 is drawn from a population that is normally distributed. The…
A: Given data : sample size, n =16 sample mean, x̄ = 21.2 sample standard deviation,s= 6.5…
Q: Compute the following (a) C6, 2 (b) C7, 7
A:
Q: Part B Based on past hospital records, the probability of a patient survive from a certain disease…
A: Given that, Based on past hospital records, the probability of a patient survive from a certain…
Q: 2. Miguel and Luis are playing a game. Miguel will roll a number cube and Luis will guess the number…
A: Here AS PER note given I have calculated 2
Q: The probability that a car will arrive at its destination is uniformly distributed from 30 minutes…
A: Given that X~Uniform(30 , 50) f(x)=1/(50-30)=1/20 , 30< X<50 = 0…
Q: The scores on a test are normally distributed with a mean of 110 and a standard deviation of 22.…
A: Let X be the random variable from Normal distribution with mean (μ) = 110 and standard deviation (σ)…
Q: The average number of mice in a 5-acre rice field is estimated to be 80. Find the probability that a…
A: Given that The average number of mice in a 5-acre rice field is estimated to be 80. Find the…
Q: study was con tion-based sample of er cirrhosis during the
A: Here we have to calculate a suitable measure for above prospective cohort study relative risk is…
Q: Determine the point estimate of the population proportion, the margin of error for the following…
A:
Q: The student government claims that 85% of all students favor an increase in student fees to buy…
A: Givenp=0.85n=12Let "x" be the no. students produced in favour of the…
Q: 5. One therapy based on classical conditioning for people with phobias is called systematic…
A: Given,mean(μ)=10standard deviation(σ)=2.37
Q: Before changes to its management staff, an automobile assembly line operation had a scheduled mean…
A: As per Bartleby guideline expert have to answer first three subparts only dear student please upload…
Q: The table below shows the data of x and ý for teh respor a) Draw the scatter diagram and draw the…
A: This question is based on regression analysis. Given data :
Q: We know that the wage distribution in the US is not normally distributed. It is closer to a pareto…
A: Given that We know that the wage distribution in the US is not normally distributed. It is closer…
Q: A psychologist is interested in constructing a 99% confidence interval for the proportion of people…
A: Given that n=712 , X=66 99% confidence interval
JUST QUESTION 18 PLEASE
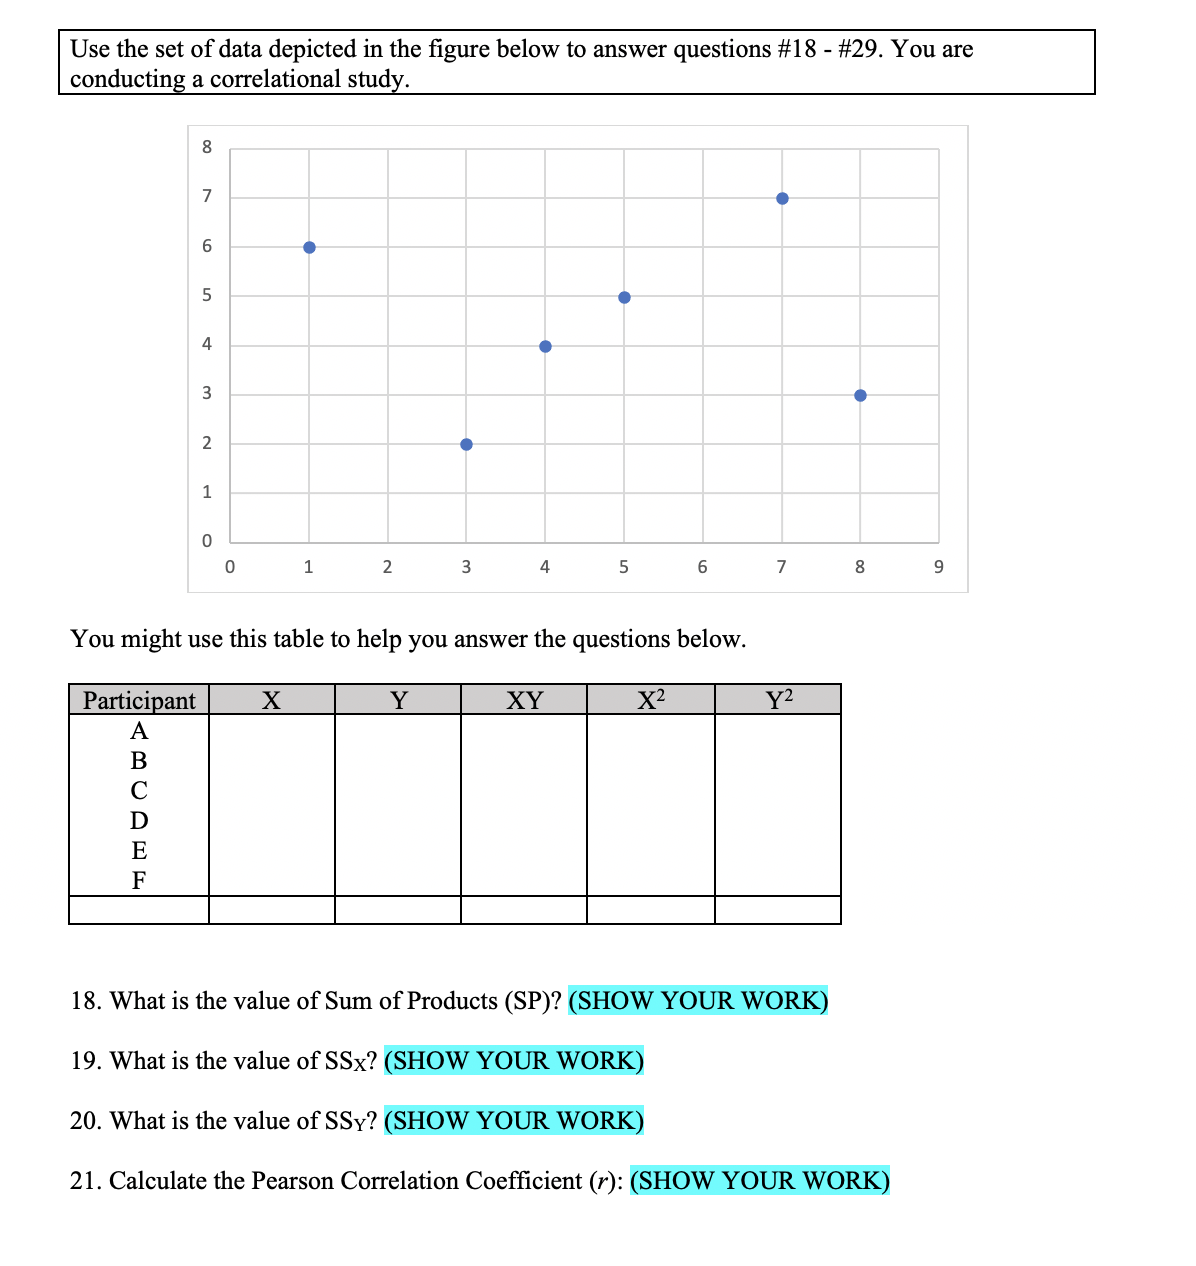
Step by step
Solved in 3 steps
- Olympic Pole Vault The graph in Figure 7 indicates that in recent years the winning Olympic men’s pole vault height has fallen below the value predicted by the regression line in Example 2. This might have occurred because when the pole vault was a new event there was much room for improvement in vaulters’ performances, whereas now even the best training can produce only incremental advances. Let’s see whether concentrating on more recent results gives a better predictor of future records. (a) Use the data in Table 2 (page 176) to complete the table of winning pole vault heights shown in the margin. (Note that we are using x=0 to correspond to the year 1972, where this restricted data set begins.) (b) Find the regression line for the data in part ‚(a). (c) Plot the data and the regression line on the same axes. Does the regression line seem to provide a good model for the data? (d) What does the regression line predict as the winning pole vault height for the 2012 Olympics? Compare this predicted value to the actual 2012 winning height of 5.97 m, as described on page 177. Has this new regression line provided a better prediction than the line in Example 2?A regression was run to determine if there is a relationship between the happiness index (y) and life expectancy in years of a given country (x). yy^=a+bxa=-1.218b=0.171 (b) Which is a possible value for the correlation coefficient, r? (c) If a country increases its life expectancy, the happiness index will increase or decrease ? (d) If the life expectancy is increased by 5 years in a certain country, how much will the happiness index change? Round to two decimal places. (e) Use the regression line to predict the happiness index of a country with a life expectancy of 59 years. Round to two decimal places.this is date for Colon Cancer New Cases 2017 y1y1=2609.58x2x2-971041 corr(x2y1)(x2y1)=0.988 Could you tell us what your variables in your equation represent for your situation? How do you determine if there is a strong or weak linear correlation from the correlation coefficient? How do you determine if it is positive or negative?
- When you solve and get an r value for the correlation coefficient, what information is revealed by this value?An emergency service wishes to see whether a relationship exists between the outside temperature and the number of emergency calls it receives for a 7-hour period. The data are shown. Temperature x No. of calls y 68 74 7 4 8 82 88 10 93 11 99 9 Test the significance of the correlation coefficient at alpha = 0.05 13 101 f = Step 1: State the hypotheses. Step 2: Find the critical values. Step 3. Compute the test value. Step 4. Make the decision. Step 5. Summarize the results.1. The Gross Horsepower of a car can influence the mileage of the car. A random sample of 32 different cars’ Gross Horsepower and mileage (Miles/gallon) is collected. From the data, suppose you got the following results: Pearson’s correlation coefficient: -0.90 The fitted regression line: Ŷ = 30. 10 − 0. 07 X d. Find the value of R2 and comment. e. From the fitted model find the values of Y for given values of X as 110. How do you interpret this value?