A simple random sample of size n = 16 is drawn from a population that is normally distributed. The sample mean is found to be x= 21.2 and the sample standard deviation is found to be s= 6.5. Determine if the population mean is different from 26 at the a = 0.05 level of significance. Complete parts (a) through (d) below. Click here to view the standard normal distribution table (page 1). Click here to view the standard normal distribution table (page 2). Click here to view the table ot criical t-values (a) Determine the null and alternative hypotheses. H,: (Type integers or decimals. Do not round.) (b) Identify the test statistic. (Round to two decimal places as needed.) Approximate the P-value. The P-value is in the range (c) State the conclusion for the test.
A simple random sample of size n = 16 is drawn from a population that is normally distributed. The sample mean is found to be x= 21.2 and the sample standard deviation is found to be s= 6.5. Determine if the population mean is different from 26 at the a = 0.05 level of significance. Complete parts (a) through (d) below. Click here to view the standard normal distribution table (page 1). Click here to view the standard normal distribution table (page 2). Click here to view the table ot criical t-values (a) Determine the null and alternative hypotheses. H,: (Type integers or decimals. Do not round.) (b) Identify the test statistic. (Round to two decimal places as needed.) Approximate the P-value. The P-value is in the range (c) State the conclusion for the test.

MATLAB: An Introduction with Applications
6th Edition
ISBN:9781119256830
Author:Amos Gilat
Publisher:Amos Gilat
Chapter1: Starting With Matlab
Section: Chapter Questions
Problem 1P

Related questions
Question
part C D
5
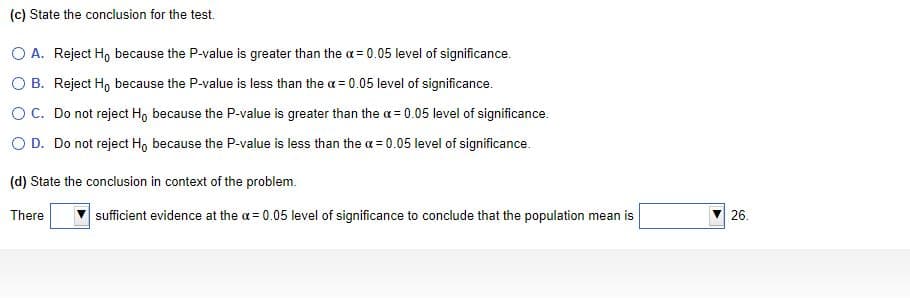
Transcribed Image Text:(c) State the conclusion for the test.
O A. Reject H, because the P-value is greater than the a = 0.05 level of significance.
O B. Reject H, because the P-value is less than the a = 0.05 level of significance.
OC. Do not reject Ho because the P-value is greater than the a= 0.05 level of significance.
O D. Do not reject Hg because the P-value is less than the a = 0.05 level of significance.
(d) State the conclusion in context of the problem.
There
sufficient evidence at the a = 0.05 level of significance to conclude that the population mean is
26.
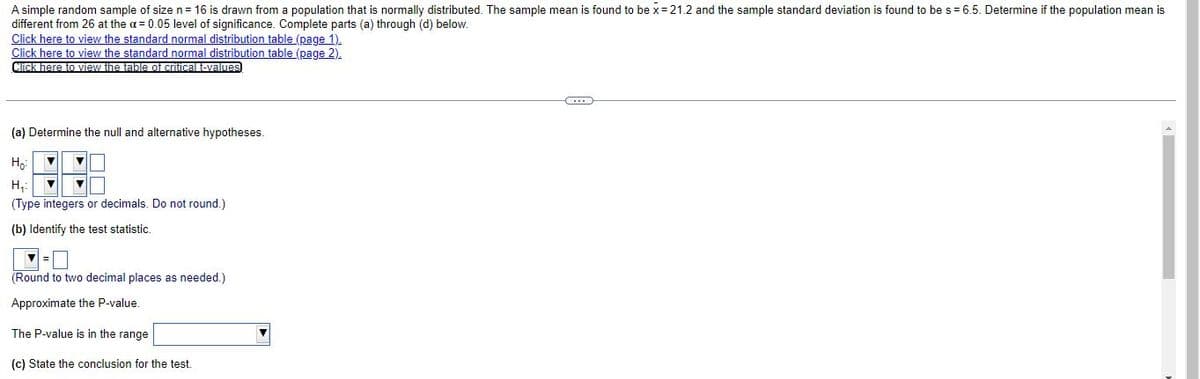
Transcribed Image Text:A simple random sample of size n= 16 is drawn from a population that is normally distributed. The sample mean is found to be x= 21.2 and the sample standard deviation is found to be s= 6.5. Determine if the population mean is
different from 26 at the a= 0.05 level of significance. Complete parts (a) through (d) below.
Click here to view the standard normal distribution table (page 1).
Click here to view the standard normal distribution table (page 2).
Click here to view the table of criticaltevalmes
(a) Determine the null and alternative hypotheses.
Ho
H,:
(Type integers or decimals. Do not round.)
(b) Identify the test statistic.
(Round to two decimal places as needed.)
Approximate the P-value.
The P-value is in the range
(c) State the conclusion for the test.
Expert Solution
This question has been solved!
Explore an expertly crafted, step-by-step solution for a thorough understanding of key concepts.

This is a popular solution!

Trending now
This is a popular solution!

Step by step
Solved in 5 steps with 1 images

Recommended textbooks for you
MATLAB: An Introduction with Applications
Statistics
ISBN:
9781119256830
Author:
Amos Gilat
Publisher:
John Wiley & Sons Inc

Probability and Statistics for Engineering and th…
Statistics
ISBN:
9781305251809
Author:
Jay L. Devore
Publisher:
Cengage Learning

Statistics for The Behavioral Sciences (MindTap C…
Statistics
ISBN:
9781305504912
Author:
Frederick J Gravetter, Larry B. Wallnau
Publisher:
Cengage Learning
MATLAB: An Introduction with Applications
Statistics
ISBN:
9781119256830
Author:
Amos Gilat
Publisher:
John Wiley & Sons Inc
Probability and Statistics for Engineering and th…
Statistics
ISBN:
9781305251809
Author:
Jay L. Devore
Publisher:
Cengage Learning
Statistics for The Behavioral Sciences (MindTap C…
Statistics
ISBN:
9781305504912
Author:
Frederick J Gravetter, Larry B. Wallnau
Publisher:
Cengage Learning

Elementary Statistics: Picturing the World (7th E…
Statistics
ISBN:
9780134683416
Author:
Ron Larson, Betsy Farber
Publisher:
PEARSON

The Basic Practice of Statistics
Statistics
ISBN:
9781319042578
Author:
David S. Moore, William I. Notz, Michael A. Fligner
Publisher:
W. H. Freeman

Introduction to the Practice of Statistics
Statistics
ISBN:
9781319013387
Author:
David S. Moore, George P. McCabe, Bruce A. Craig
Publisher:
W. H. Freeman