180% 3.198 3.22% th fixed-rate auto loans had loan rates as fo 1958 3.659 4.20% he Equality of Mean Loan Rates for ixed 48-Month Auto Loans
180% 3.198 3.22% th fixed-rate auto loans had loan rates as fo 1958 3.659 4.20% he Equality of Mean Loan Rates for ixed 48-Month Auto Loans

MATLAB: An Introduction with Applications
6th Edition
ISBN:9781119256830
Author:Amos Gilat
Publisher:Amos Gilat
Chapter1: Starting With Matlab
Section: Chapter Questions
Problem 1P

Related questions
Question
Parts D and E
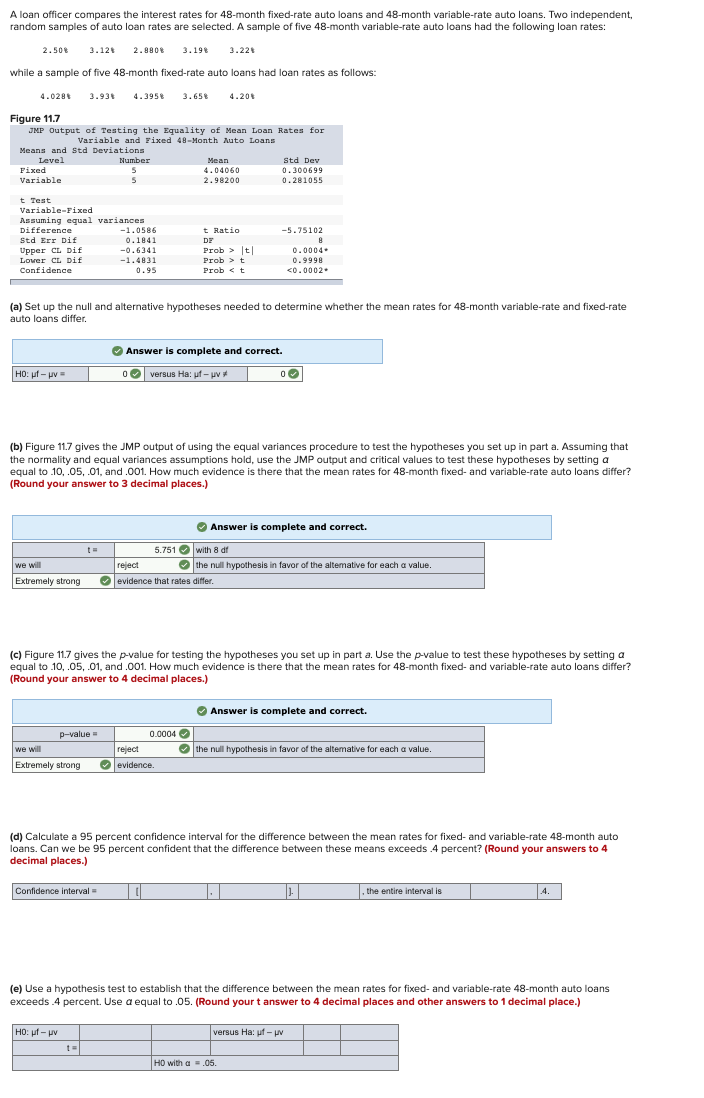
Transcribed Image Text:A loan officer compares the interest rates for 48-month fixed-rate auto loans and 48-month variable-rate auto loans. Two independent,
random samples of auto loan rates are selected. A sample of five 48-month variable-rate auto loans had the following loan rates:
2.50% 3.12% 2.880% 3.198 3.22%
while a sample of five 48-month fixed-rate auto loans had loan rates as follows:
4.028* 3.93% 4.3958 3.658 4.20%
Figure 11.7
JMP Output of Testing the Equality of Mean Loan Rates for
Variable and Fixed 48-Month Auto Loans
Means and Std Deviations
Level
Fixed
Variable
t Test
Variable-Fixed
Assuming equal variances
Difference
Std Err Dif
Upper CL Dif
Lover CL Dif
Confidence
HO: uf- uv
Number
5
5
t=
p-value=
we will
Extremely strong
-1.0586
0.1841
-0.6341
-1.4831
0.95
(a) Set up the null and alternative hypotheses needed to determine whether the mean rates for 48-month variable-rate and fixed-rate
auto loans differ,
Confidence interval=
HO: uf- uv
Mean
4.04060
2.98200
t Ratio
DE
(b) Figure 11.7 gives the JMP output of using the equal variances procedure to test the hypotheses you set up in part a. Assuming that
the normality and equal variances assumptions hold, use the JMP output and critical values to test these hypotheses by setting a
equal to 10, .05, .01, and .001. How much evidence is there that the mean rates for 48-month fixed- and variable-rate auto loans differ?
(Round your answer to 3 decimal places.)
Prob > |t|
Prob > t
Prob t
✔ Answer is complete and correct.
0 versus Ha: uf- uv
5.751 with 8 df
we will
reject
✔ the null hypothesis in favor of the alterative for each a value.
Extremely strong ✔ evidence that rates differ.
0.0004
reject
evidence.
| ||
Std Dev
0.300699
0.281055
(c) Figure 11.7 gives the p-value for testing the hypotheses you set up in part a. Use the p-value to test these hypotheses by setting a
equal to 10, .05, .01, and .001. How much evidence is there that the mean rates for 48-month fixed- and variable-rate auto loans differ?
(Round your answer to 4 decimal places.)
-5.75102
8
0.0004
0.9998
<0.0002.
0
✔ Answer is complete and correct.
(d) Calculate a 95 percent confidence interval for the difference between the mean rates for fixed- and variable-rate 48-month auto
loans. Can we be 95 percent confident that the difference between these means exceeds .4 percent? (Round your answers to 4
decimal places.)
1.
✔ Answer is complete and correct.
the null hypothesis in favor of the altemative for each a value.
HO with a = .05.
versus Ha: uf- uv
J.
(e) Use a hypothesis test to establish that the difference between the mean rates for fixed- and variable-rate 48-month auto loans
exceeds.4 percent. Use a equal to .05. (Round your t answer to 4 decimal places and other answers to 1 decimal place.)
the entire interval is
4.
Expert Solution
This question has been solved!
Explore an expertly crafted, step-by-step solution for a thorough understanding of key concepts.

This is a popular solution!

Trending now
This is a popular solution!

Step by step
Solved in 2 steps

Recommended textbooks for you
MATLAB: An Introduction with Applications
Statistics
ISBN:
9781119256830
Author:
Amos Gilat
Publisher:
John Wiley & Sons Inc

Probability and Statistics for Engineering and th…
Statistics
ISBN:
9781305251809
Author:
Jay L. Devore
Publisher:
Cengage Learning

Statistics for The Behavioral Sciences (MindTap C…
Statistics
ISBN:
9781305504912
Author:
Frederick J Gravetter, Larry B. Wallnau
Publisher:
Cengage Learning
MATLAB: An Introduction with Applications
Statistics
ISBN:
9781119256830
Author:
Amos Gilat
Publisher:
John Wiley & Sons Inc
Probability and Statistics for Engineering and th…
Statistics
ISBN:
9781305251809
Author:
Jay L. Devore
Publisher:
Cengage Learning
Statistics for The Behavioral Sciences (MindTap C…
Statistics
ISBN:
9781305504912
Author:
Frederick J Gravetter, Larry B. Wallnau
Publisher:
Cengage Learning

Elementary Statistics: Picturing the World (7th E…
Statistics
ISBN:
9780134683416
Author:
Ron Larson, Betsy Farber
Publisher:
PEARSON

The Basic Practice of Statistics
Statistics
ISBN:
9781319042578
Author:
David S. Moore, William I. Notz, Michael A. Fligner
Publisher:
W. H. Freeman

Introduction to the Practice of Statistics
Statistics
ISBN:
9781319013387
Author:
David S. Moore, George P. McCabe, Bruce A. Craig
Publisher:
W. H. Freeman