19. Achievement Test Scores The data shown represen the scores on a national achievement test for a group of 10th-grade students. Find the approximate percentile ranks of these scores by constructing a percentile graph. a. 220 b. 245 c. 276 d. 280 e. 300 Score 196.5-217.5 217.5-238.5 238.5-259.5 259.5-280.5 280.5-301.5 301.5-322.5 Frequency 17 48 For the same data, find the approximate scores that cor- respond to these percentiles. f 15th g. 29th h. 43rd i. 65th j. 80th
19. Achievement Test Scores The data shown represen the scores on a national achievement test for a group of 10th-grade students. Find the approximate percentile ranks of these scores by constructing a percentile graph. a. 220 b. 245 c. 276 d. 280 e. 300 Score 196.5-217.5 217.5-238.5 238.5-259.5 259.5-280.5 280.5-301.5 301.5-322.5 Frequency 17 48 For the same data, find the approximate scores that cor- respond to these percentiles. f 15th g. 29th h. 43rd i. 65th j. 80th

MATLAB: An Introduction with Applications
6th Edition
ISBN:9781119256830
Author:Amos Gilat
Publisher:Amos Gilat
Chapter1: Starting With Matlab
Section: Chapter Questions
Problem 1P

Related questions
Question
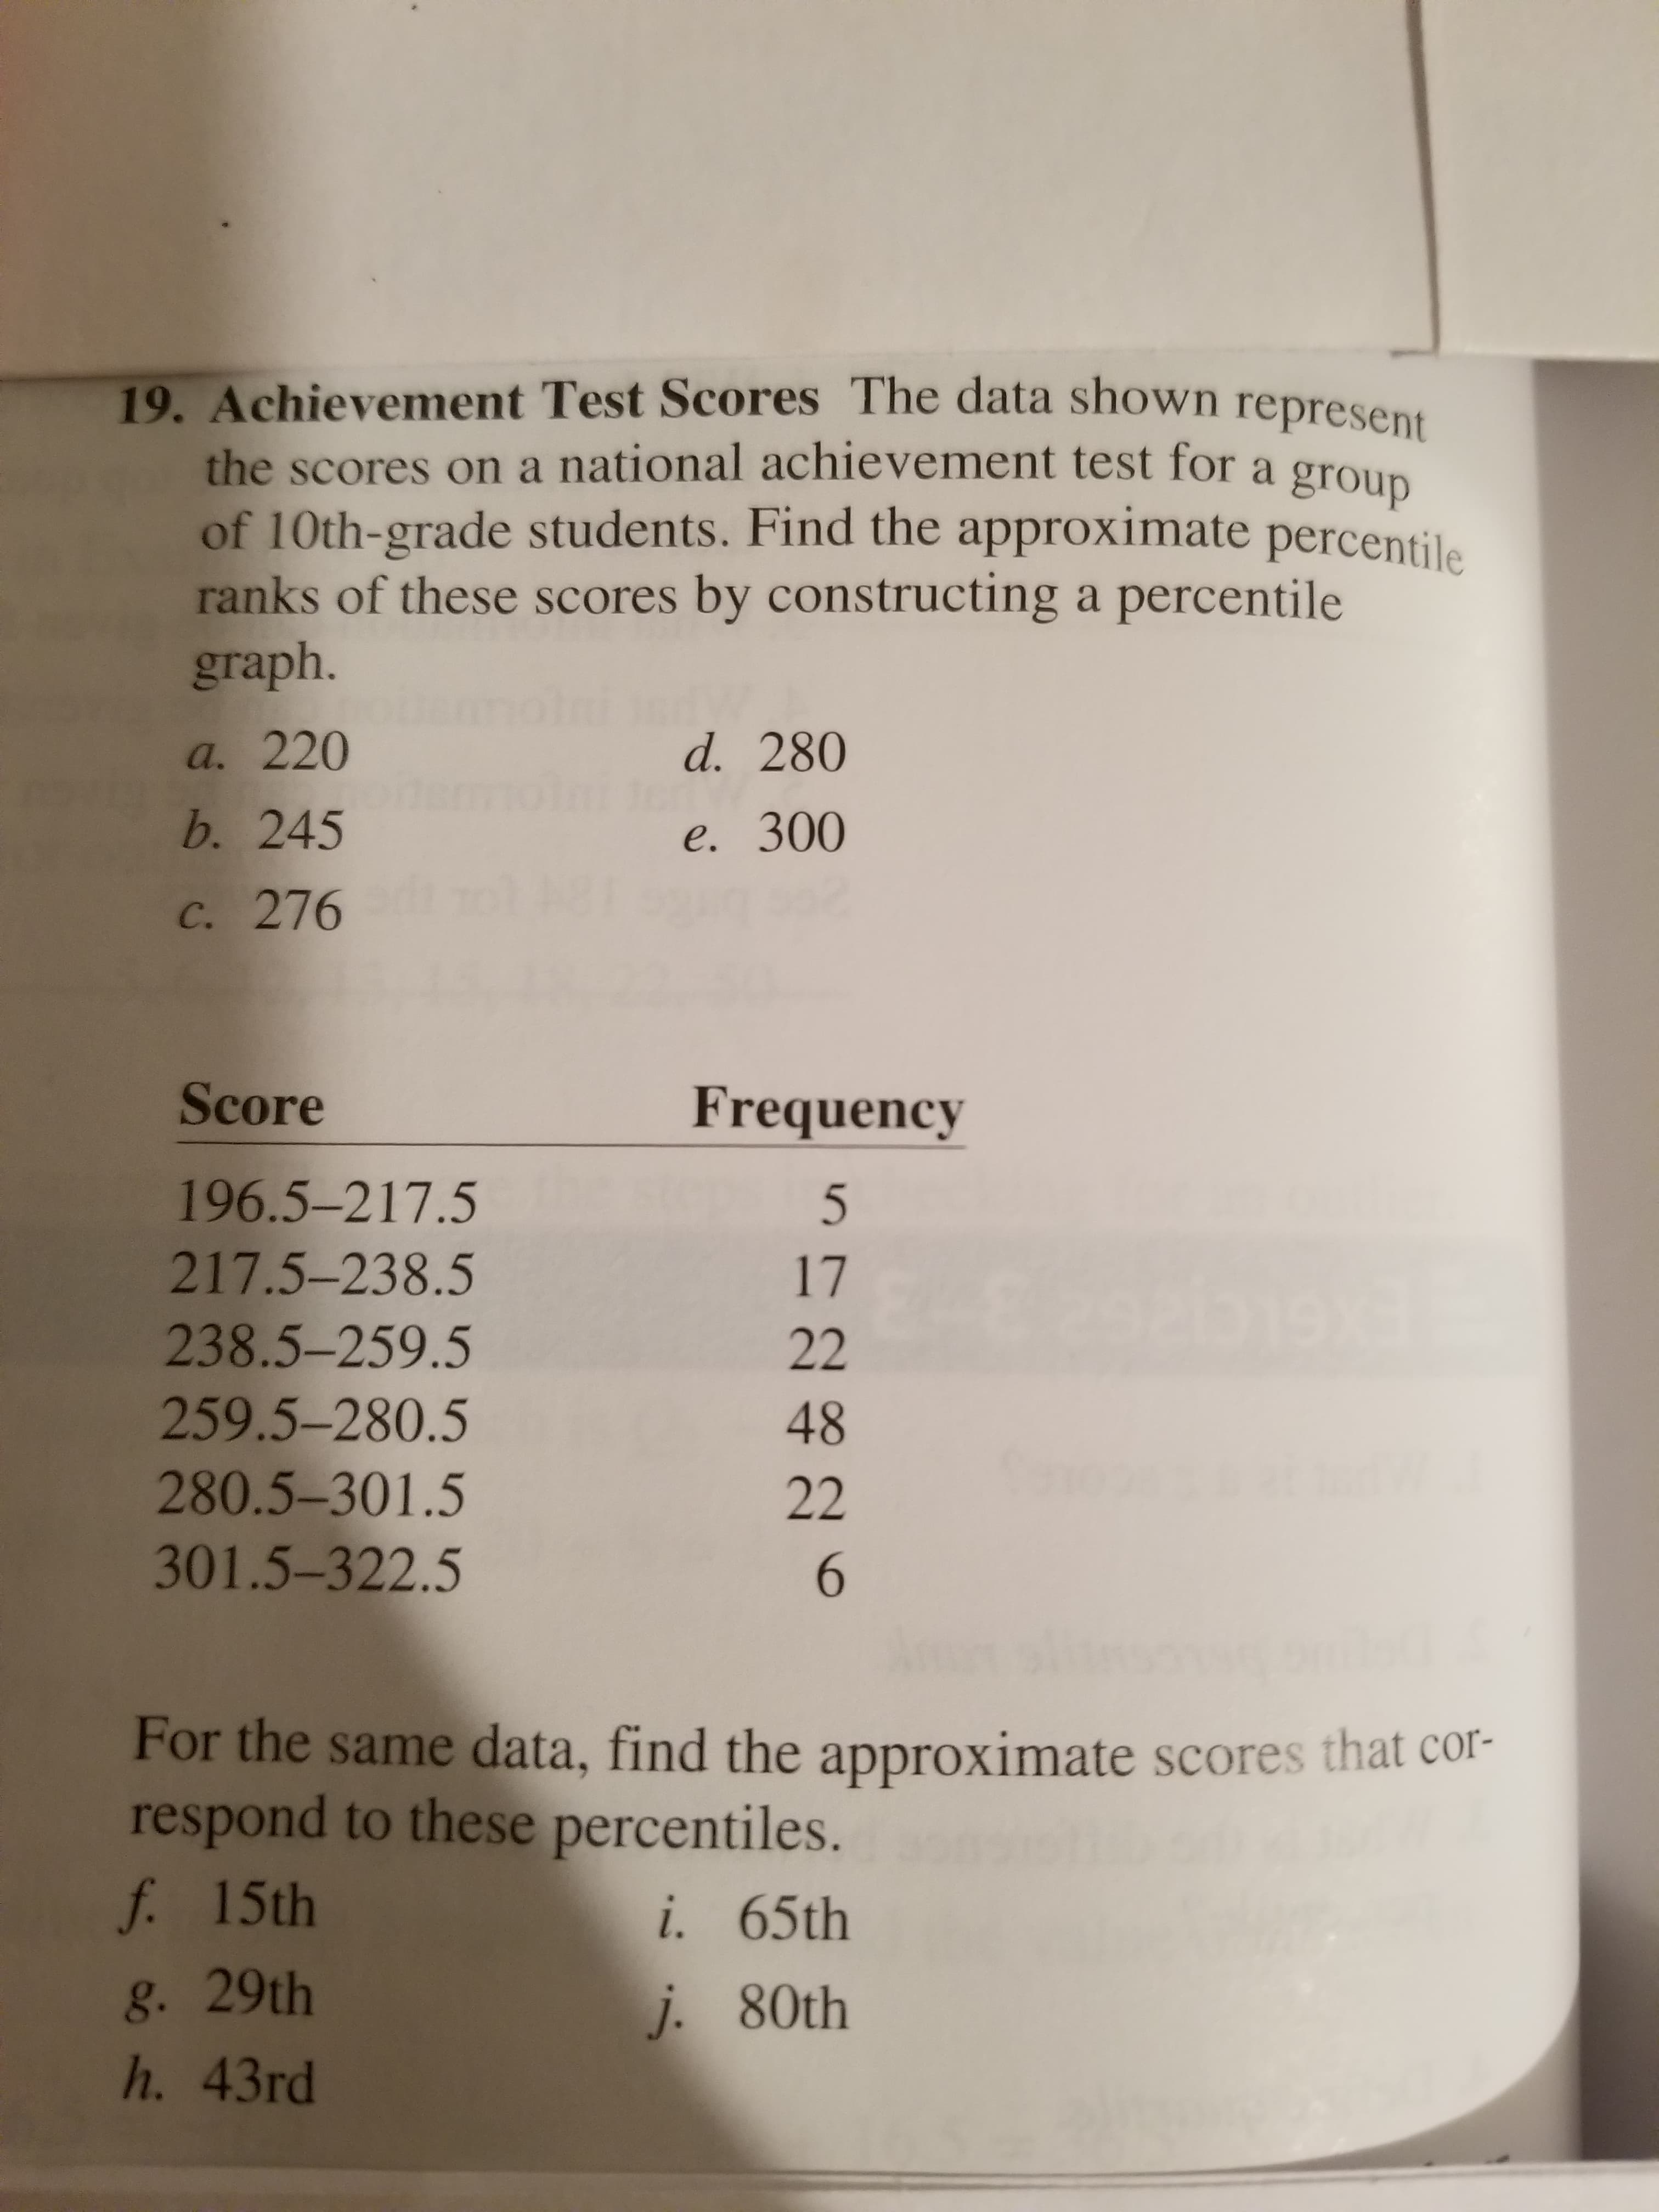
Transcribed Image Text:19. Achievement Test Scores The data shown represen
the scores on a national achievement test for a group
of 10th-grade students. Find the approximate percentile
ranks of these scores by constructing a percentile
graph.
a. 220
b. 245
c. 276
d. 280
e. 300
Score
196.5-217.5
217.5-238.5
238.5-259.5
259.5-280.5
280.5-301.5
301.5-322.5
Frequency
17
48
For the same data, find the approximate scores that cor-
respond to these percentiles.
f 15th
g. 29th
h. 43rd
i. 65th
j. 80th
Expert Solution
This question has been solved!
Explore an expertly crafted, step-by-step solution for a thorough understanding of key concepts.

This is a popular solution!

Trending now
This is a popular solution!

Step by step
Solved in 4 steps with 4 images

Recommended textbooks for you
MATLAB: An Introduction with Applications
Statistics
ISBN:
9781119256830
Author:
Amos Gilat
Publisher:
John Wiley & Sons Inc

Probability and Statistics for Engineering and th…
Statistics
ISBN:
9781305251809
Author:
Jay L. Devore
Publisher:
Cengage Learning

Statistics for The Behavioral Sciences (MindTap C…
Statistics
ISBN:
9781305504912
Author:
Frederick J Gravetter, Larry B. Wallnau
Publisher:
Cengage Learning
MATLAB: An Introduction with Applications
Statistics
ISBN:
9781119256830
Author:
Amos Gilat
Publisher:
John Wiley & Sons Inc
Probability and Statistics for Engineering and th…
Statistics
ISBN:
9781305251809
Author:
Jay L. Devore
Publisher:
Cengage Learning
Statistics for The Behavioral Sciences (MindTap C…
Statistics
ISBN:
9781305504912
Author:
Frederick J Gravetter, Larry B. Wallnau
Publisher:
Cengage Learning

Elementary Statistics: Picturing the World (7th E…
Statistics
ISBN:
9780134683416
Author:
Ron Larson, Betsy Farber
Publisher:
PEARSON

The Basic Practice of Statistics
Statistics
ISBN:
9781319042578
Author:
David S. Moore, William I. Notz, Michael A. Fligner
Publisher:
W. H. Freeman

Introduction to the Practice of Statistics
Statistics
ISBN:
9781319013387
Author:
David S. Moore, George P. McCabe, Bruce A. Craig
Publisher:
W. H. Freeman