19. Given the following econometric model Y₁ = P + B₁X₁ + U₁ What is the conditional expectation of E(Y,IX,)? 20. Given we know the population = 2.1, ₁ = 3, and an individual in the survey has an X with the value of 4. What is the conditional expectation of Y for this individual, E(Y₁|X= 4)?
19. Given the following econometric model Y₁ = P + B₁X₁ + U₁ What is the conditional expectation of E(Y,IX,)? 20. Given we know the population = 2.1, ₁ = 3, and an individual in the survey has an X with the value of 4. What is the conditional expectation of Y for this individual, E(Y₁|X= 4)?

Functions and Change: A Modeling Approach to College Algebra (MindTap Course List)
6th Edition
ISBN:9781337111348
Author:Bruce Crauder, Benny Evans, Alan Noell
Publisher:Bruce Crauder, Benny Evans, Alan Noell
Chapter5: A Survey Of Other Common Functions
Section5.6: Higher-degree Polynomials And Rational Functions
Problem 1TU: The following fictitious table shows kryptonite price, in dollar per gram, t years after 2006. t=...

Related questions
Question
8
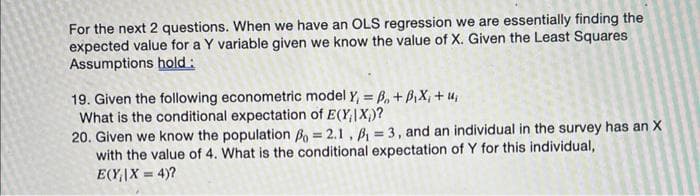
Transcribed Image Text:For the next 2 questions. When we have an OLS regression we are essentially finding the
expected value for a Y variable given we know the value of X. Given the Least Squares
Assumptions hold:
19. Given the following econometric model Y₁ = B₁ + B,X, + u₁
What is the conditional expectation of E(XIX)?
20. Given we know the population Po= 2.1, B₁ = 3, and an individual in the survey has an X
with the value of 4. What is the conditional expectation of Y for this individual,
E(Y₁|X= 4)?
Expert Solution
This question has been solved!
Explore an expertly crafted, step-by-step solution for a thorough understanding of key concepts.

Step by step
Solved in 2 steps

Recommended textbooks for you
Functions and Change: A Modeling Approach to Coll…
Algebra
ISBN:
9781337111348
Author:
Bruce Crauder, Benny Evans, Alan Noell
Publisher:
Cengage Learning

College Algebra
Algebra
ISBN:
9781305115545
Author:
James Stewart, Lothar Redlin, Saleem Watson
Publisher:
Cengage Learning

Linear Algebra: A Modern Introduction
Algebra
ISBN:
9781285463247
Author:
David Poole
Publisher:
Cengage Learning
Functions and Change: A Modeling Approach to Coll…
Algebra
ISBN:
9781337111348
Author:
Bruce Crauder, Benny Evans, Alan Noell
Publisher:
Cengage Learning
College Algebra
Algebra
ISBN:
9781305115545
Author:
James Stewart, Lothar Redlin, Saleem Watson
Publisher:
Cengage Learning
Linear Algebra: A Modern Introduction
Algebra
ISBN:
9781285463247
Author:
David Poole
Publisher:
Cengage Learning