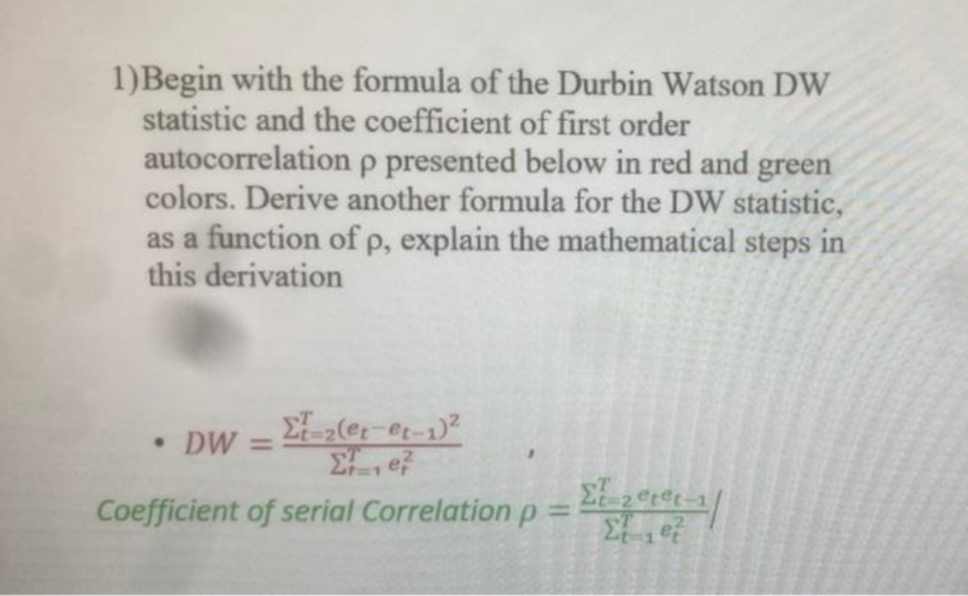
1)Begin with the formula of the Durbin Watson DW statistic and the coefficient of first order autocorrelation p presented below in red and green colors. Derive another formula for the DW statistic, as a function of p, explain the mathematical steps in this derivation • DW = 2(er-@t-1)? E ef Coefficient of serial Correlation p = 2i 2 °t°t_1/


Q: When conducting a one sample t-test for , which of the following is the correct formula for…
A: According to the given information in this question We need to write the formula for one sample t…
Q: The data below shows the depth of a snowpack ?, in inches, of ? days after May 1 ? days May 1 1 3…
A: For the given data Find the equation of the least-squares regression line ŷ and the linear…
Q: August and September 2005, Hurricanes Ka stroyed, and of those that survived, many r due to the…
A: Given, For orleans parish : sample size (n1) = 369 x1 = 82 sample proportion (p1^) = x1/n1 = 82/369…
Q: Do the poor spend the same amount of time in the shower as the rich? The results of a survey asking…
A:
Q: On the right are raw test scores from a history test. a. Construct an ordered stem and leaf plot for…
A: As per our guidelines we can solve first three sub part of question and rest can be reposted.…
Q: One-Sample Test Due to grade deflation in which professor have been giving too many failing grades,…
A: 1. Consider that p is the true proportion of students passed by the particular professor.
Q: 10. A lottery exists where balls numbered 1 to 23 are placed in an urn. To win, you must match the…
A:
Q: The amount of money that college students spend on food each week during the academic year is…
A: Given,mean(μ)=31.28standard deviation(σ)=11.42sample size(n)=10
Q: What is the standard error for the difference between the two means
A: here from given information For Private sample mean = x¯ = 42.5 s2x = 48.7 nx = 10 For pubilc…
Q: If we can perform a census (i.e. collect data from the entire population), then we can forget about…
A: Given that If we can perform a census (i.e. collect data from the entire population), then we can…
Q: Manuel wants to find the average time it takes Northside High School students to run a lap around…
A: Since the question to be answered is not mentioned, we'll be answering the first question only.…
Q: A random sample of five college women was asked for their own heights and their mothers' heights.…
A: Find a 95% confidence interval for the parameter you defined in part (a), in inches. (Use daughters…
Q: In a certain game of chance, a wheel consists of 32 slots numbered 00, 0, 1, 2,..., 30. To play the…
A:
Q: Which of the following distribution belongs to continuous distribution? A.The temperature at which…
A: Which of the following distribution belongs to continuous distribution?
Q: Defective electronics: A team of designers was given the task of reducing the defect rate in the…
A: Let us denote, x1=258 n1=970 x2=171 n2=851…
Q: The following items represent the number of birds observed at a given feeder over the past several…
A: Arranging ins descending order 2,19,33,35,48,68,74
Q: L3Q8.Find the type of relationship that exists between the two variables x and y in the scatter…
A: Firstly make a x and y data table from the scatter plot. Then use correlation coefficient concept…
Q: 9. A physician believes that the exercise habits of Avi's Bright Kids 1.0 are different from the…
A: Hey there! Thank you for posting the question. Since there are multiple questions posted, we will…
Q: In the country of United States of Heightlandia, the height measurements of ten-year-old children…
A:
Q: Questions 11-15 are about this data, taken from a sample: {0, 0, 1, 4, 5} 11. What is the mean of…
A: We have given data { 0, 0, 1, 4, 5}
Q: Problem 4: Use R to solve this problem. Give your code with your solutions. 1- Find the 98th…
A: R programming use to write the command
Q: 11. A baseball team consists of three outfielders, four infielders, a pitcher, and a catcher.…
A: There are ? possible batting orders
Q: Compute the test statistic
A: here from given information for private mean = x¯= 42.5 variance = s2x = 48.7 sample size nx = 10…
Q: If n=480 and p^ (p-hat) =0.45, find the margin of error at a 90% confidence level Give your answer…
A:
Q: Traveler Spending The data show the traveler spending in billions of dollars for a recent year for a…
A: We have given data are 21,33.1,21.7,58.6,23.8,110.3,30.3,24.6,74.9,60.6,40.9,45.9,65.7,76.4 We have…
Q: 13. The following table shows the distribution of nappies consumed per day by number of babies in a…
A: Hi! Thank you for the question, as per the honor code, we are allowed to answer three sub-parts at a…
Q: A researcher wishes to estimate, with 90%onfidence, the population proportion of adults who think…
A: Givenconfidence level(α)=90%Margin of error(E)=4%=0.04
Q: Since Kristine has been a long-time loyal customer, Kristine is able to place a rush order at $30…
A:
Q: selected at random. Complete parts (a) through (c). Unsure Total Support 157 Oppose 330 Males 12 499…
A: Given that : A 2 × 3 contingency table is given here by using this information ane basic probability…
Q: 10. Which of the following is a true statement? A. The alternative hypothesis is stated in terms of…
A: We have to choose which of the statement is true. We have to find confidence level. This is z-test…
Q: A study found that 77% of blogers are mathematicians while only 61% of those who are not blogers are…
A: Probability can be subjective or objective measure of likelihood of occurrence of an event.
Q: Find the slope from the line of best fit y = -2-X. O -2 0-¹ O O 2
A: Given : The line of best fit y y=-2-12x
Q: 3. An extensive study of the cost of health care in the United States presented data showing that…
A:
Q: GA-GSE Statistical Reasoning B X rn.edgenuity.com/player/ t-table x | + Cumulative Exam Cumulative…
A:
Q: Question: Estimate the amount of memory storage used y (GB) when the number of server users x…
A: Introduction: The response variable, y is the amount of memory storage used (GB), and the…
Q: A binomial probability experiment is conducted with the given parameters. Compute the probability of…
A: According to the given information, we know that, Sample size, n = 12 Probability, p = 0.9
Q: Which cell contributes most to the chi-square statistic? Americans in the United States who…
A: The output shows the cell counts, the expected cell counts and the chi-square stateistc.
Q: Find the complement of each of the given probabilities:
A:
Q: Since the 2-score in freestyle [Select] higher lower score in backstroke, his time in when compared…
A: here given , Sam is a competitive swimmer that competes in the 100 m freestyle and 100 m…
Q: 1) In which scatter diagram is r = -1? a b. 12- 10+ 10+ +8 6+ 4+ 2+ 3 1 2 3 4 d. 12- 12- 10+ 10- 8-…
A: Correlation: Correlation a measure which indicates the “go-togetherness” of two data sets. It can be…
Q: If you go through the profiles of 200 people in a population where you expect 25% of the population…
A: here define events , dateable = D swipe Right = R swipe left = L here p(R | D) = 0.80 p(L |…
Q: A study found that 30% of gardeners (M) are runners (G). State this result as a probability:…
A: Statement for the probability
Q: Browsing on the mobile device. A 2012 survey of 2292 American adults indicates that 20% of cell…
A:
Q: What would it be the coefficient of determination if the sums of squares due to regression (SSR) is…
A:
Q: O8750 O2916.67 O 7600 O 16350 IS
A:
Q: The average number of strawberries that come in a pint is 27.9, with a standard deviation of 7.8.…
A:
Q: that we flip a coin twice and it comes up. HH. standard Bayesian information processor: i) What is…
A: *Answer:
Q: dy Question: 2. In order to determine the average weight of carry-on luggage by passengers in…
A:
Q: 1(b). At 99% confidence, what is the margin of error?
A: here use given data table
Q: A Harris Poll survey of smokers in which 805 of a sample of 993 smokers agreed that smoking would…
A:

Step by step
Solved in 2 steps with 2 images

- A researcher examined number of monthly meetings (2 or 4) on job satisfaction. If the t obtained for a correlated groups t-test was 2.50, df = 3, and the t critical = 2.353, what should s/he conclude?12/20 Compute the linear correlation coefficient between the weight of a car and its miles per gallon. R =_. Round to three decimal places as needed.Let X1, . . . , Xn ∼ iid Unif(θ1, θ2), where both θ1 and θ2 are unknown. Find the MOM estimator and compare them to the MLE.
- Solve d Critical Values for Correlation Coefficient n 3 0.997 4 0.950 5 0.878 6 0.811 7 0.754 8 0.707 9 0.666 10 0.632 11 0.602 12 0.576 13 0.553 14 0.532 15 0.514 16 0.497 17 0.482 18 0.468 19 0.456 20 0.444 21 0.433 22 0.423 23 0.413 24 0.404 25 0.396 26 0.388 27 0.381 28 0.374 29 0.367 30 0.361 nThe National Safety Council of the U.S. released the following data on the incidence rates for fatal or lost-worktime injuries per 100 employees for several industries in three recent years. Compute r for each pair of years and determine which years are most highly correlated. Calculate r using 1. the formula and 2. function. Industry Year 1 Year 2 Year 3 Textile 0.46 0.48 0.69 Chemical 0.52 0.62 0.63 Communication 0.9 0.72 0.81 Machinery 1.5 1.74 2.1 Services 2.89 2.03 2.46 Nonferrous metals 1.8 1.92 2 Food 3.29 3.18 3.17 Government 5.73 4.43 4 By formula By Function By formula By Function r1 r2 r3 Please provide a step by step of calculation in excelto give me an understaning on how to calculate in future Thank you in advanceTo increase egg production, a farmer decided to increase the number of times the lights in his henhouse were on. Ten hens were randomly selected, and the number of eggs each produced was recorded. After one week of lengthened light time, the same hens were monitored again. The data is given here. At α = 0.05, can it be concluded that the increased light time increased egg production? Hen 1 2 3 4 5 6 7 8 9 10 Before 4 3 8 7 6 4 9 7 6 5 After 6 5 9 7 4 5 10 6 9 6
- Note- bolded quiz have already answered A possible important environmental determinant of lung function in children is the amount of cigarette smoking in the home. Suppose this question is studied by selecting two groups: Group 1 consists of 23 nonsmoking children 5-9 years of age, both of whose parents smoke, who have a mean forced expiratory volume (FEV) of 2.1 L and a standard deviation of 0.7 L; group 2 consists of 20 nonsmoking children of comparable age, neither of whose parents smoke, who have a mean FEV of 2.3 L and a standard deviation of 0.4 L.*8.31 What are the appropriate null and alternative hypotheses to compare the means of the two groups? *8.32 What is the appropriate test procedure for the hypotheses in Problem 8.31? *8.33 Carry out the test in Problem 8.32 using the criticalvalue method. *8.34 Provide a 95% CI for the true mean difference in FEV between 5- to 9-year-old children whose parents smoke and comparable children whose parents do not smoke. *8.35 Assuming…Which one is correct? Consider the Cobb- Douglas production function, Q = aK^bL^c ; b and ca) Can be estimated using OLS on the equation Q = a +bK+cL b) Can be calculated from the covariances of K and L with Qc) cannot be estimated using OLS d) can be estimated using OLS on the equation log(Q) =log(a) +b log(K) +b log(L)A researcher is interested in testing the relationship between smoking and BMI (kg/m2) in adults aged 30-45. In order to test this association, the researcher divides smoking into currently more than a pack a day, currently less than a pack a day, and never smokers. The following table represents the BMIs for each participant enrolled by their respective smoking category. Current Smoker (≥1pack/day) Current Smoker (<1 pack/day Never Smoked 26.7 29.4 22.1 29.4 28.6 30.4 24.3 27.4 21.3 28.4 23.2 26.4 21.6 20.1 19.7 27.4 20.6 19.8 26.8 19.7 21.6 36.4 19.6 22.3 31.5 21.6 24.3 27.4 21.5 *Continue as though all assumptions for ANOVA are met. A) Calculate the MSW and MSB for the data represented above. B) Carry out a formal test for a one-way analysis of variance among the groups and interpret your results.
- Refer to Exercise 8.S.6. Analyze these data using a Wilcoxon signed-rank test.A dietitian wishes to see if a person’s cholesterol level will be changed if the diet is supplemented by a certain mineral. Four subjects were pre-tested, and they took the mineral supplement for a 6-week period. The results are shown in the table. Is there sufficient evidence to conclude that the population mean of cholesterol levels has been changed after six weeks at α=0.2α=0.2? Assume that the differences are from an approximately normally distributed population. Subject Cholestrol Level (mg/dl) Cholestrol Level after 6 Weeks (mg/dl) dd ¯dd¯ (d−¯d)2(d-d¯)2 1 206 217 11 2 219 184 -35 3 202 204 2 4 213 205 -8 Total -30 a) Calculate the mean, the sum of the squared deviation from the mean, and the standard deviation of differences. Do not include the unit for each answer: ¯d=d¯= (do not round) ∑(d−¯d)2=∑(d-d¯)2= (do not round) sd=sd= (rounded to one decimal place) b) Perform the hypothesis test in the following steps: Step 1.…If the value of Cronbach’s alpha is 0.07, it means ___________; a. Research instrument is not reliable b. Research instrument is internally consistent c. Data is reliable d. Data is internally consistent