1) Blood Y = Blood pressure, X = Dose The reduction in blood pressure in rats was measured 2 hours post-dose after the rats were given a test compound at different dosages. (a) Plot the data and fit the LS line. (b) Transform Dose to log(X) and refit. (c) Plot the residuals from both models. Discuss.
1) Blood Y = Blood pressure, X = Dose The reduction in blood pressure in rats was measured 2 hours post-dose after the rats were given a test compound at different dosages. (a) Plot the data and fit the LS line. (b) Transform Dose to log(X) and refit. (c) Plot the residuals from both models. Discuss.

Glencoe Algebra 1, Student Edition, 9780079039897, 0079039898, 2018
18th Edition
ISBN:9780079039897
Author:Carter
Publisher:Carter
Chapter10: Statistics
Section10.3: Measures Of Spread
Problem 1GP

Related questions
Question
1) Blood Y = Blood pressure, X = Dose
The reduction in blood pressure in rats was measured 2 hours post-dose after the rats were given a test compound at different dosages.
(a) Plot the data and fit the LS line.
(b) Transform Dose to log(X) and refit.
(c) Plot the residuals from both models. Discuss.
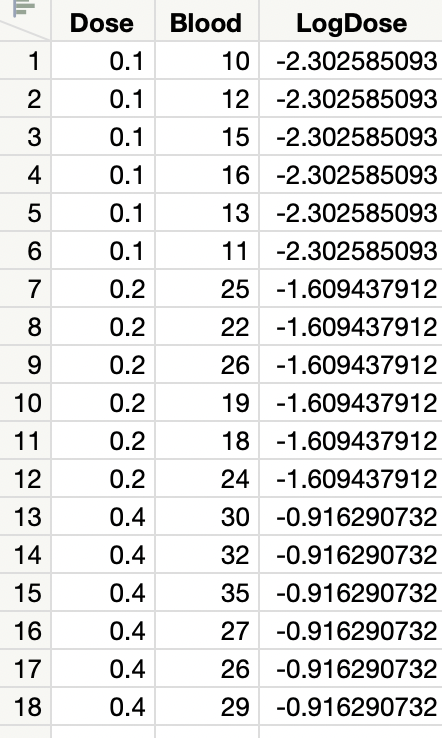
Transcribed Image Text:Dose
Blood
LogDose
1
0.1
10 -2.302585093
2
0.1
12 -2.302585093
3
0.1
15 -2.302585093
4
0.1
16 -2.302585093
5
0.1
13 -2.302585093
0.1
11 -2.302585093
7
0.2
25 -1.609437912
8.
0.2
22 -1.609437912
0.2
26 -1.609437912
10
0.2
19 -1.609437912
11
0.2
18 -1.609437912
12
0.2
24 -1.609437912
13
0.4
30 -0.916290732
14
0.4
32 -0.916290732
15
0.4
35 -0.916290732
16
0.4
27 -0.916290732
17
0.4
26 -0.916290732
18
0.4
29 -0.916290732
Expert Solution
This question has been solved!
Explore an expertly crafted, step-by-step solution for a thorough understanding of key concepts.

This is a popular solution!

Trending now
This is a popular solution!

Step by step
Solved in 4 steps with 5 images

Recommended textbooks for you
Glencoe Algebra 1, Student Edition, 9780079039897…
Algebra
ISBN:
9780079039897
Author:
Carter
Publisher:
McGraw Hill

Algebra & Trigonometry with Analytic Geometry
Algebra
ISBN:
9781133382119
Author:
Swokowski
Publisher:
Cengage
Glencoe Algebra 1, Student Edition, 9780079039897…
Algebra
ISBN:
9780079039897
Author:
Carter
Publisher:
McGraw Hill
Algebra & Trigonometry with Analytic Geometry
Algebra
ISBN:
9781133382119
Author:
Swokowski
Publisher:
Cengage