1)From Table 3, compute the mortality rate ratio for diabetes for Asian Americans compared to White America 2)Use the mortality rate ratio computed in question 1 to describe a health disparity in diabetes between Asian Americans and White Americans. 3)What information about diabetes mortality does Years of Potential Life Lost provide table 1 In your response, describe how this information is different from the information we get from diabetes mortality rate.
1)From Table 3, compute the mortality rate ratio for diabetes for Asian Americans compared to White America 2)Use the mortality rate ratio computed in question 1 to describe a health disparity in diabetes between Asian Americans and White Americans. 3)What information about diabetes mortality does Years of Potential Life Lost provide table 1 In your response, describe how this information is different from the information we get from diabetes mortality rate.

Nutrition Through The Life Cycle
7th Edition
ISBN:9781337919333
Author:Brown, Judith E.
Publisher:Brown, Judith E.
Chapter17: Adult Nutrition -conditions And Interventions
Section: Chapter Questions
Problem 2RQ

Related questions

Question
1)From Table 3, compute the mortality rate ratio for diabetes for Asian Americans compared to White America
2)Use the mortality rate ratio computed in question 1 to describe a health disparity in diabetes between Asian Americans and White Americans.
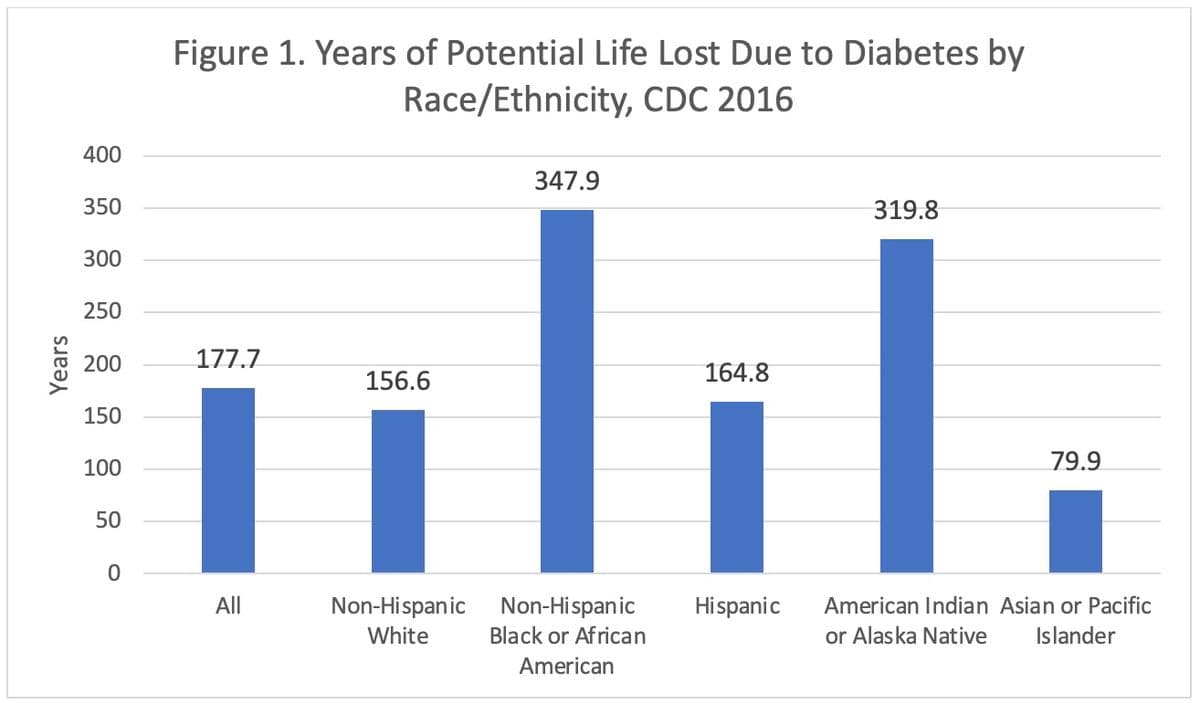
3)What information about diabetes mortality does Years of Potential Life Lost provide table 1 In your response, describe how this information is different from the information we get from diabetes mortality rate.
Transcribed Image Text:Years
400
350
300
250
200
150
100
50
0
Figure 1. Years of Potential Life Lost Due to Diabetes by
Race/Ethnicity, CDC 2016
177.7
All
156.6
Non-Hispanic
White
347.9
Non-Hispanic
Black or African
American
164.8
Hispanic
319.8
79.9
American Indian Asian or Pacific
or Alaska Native Islander
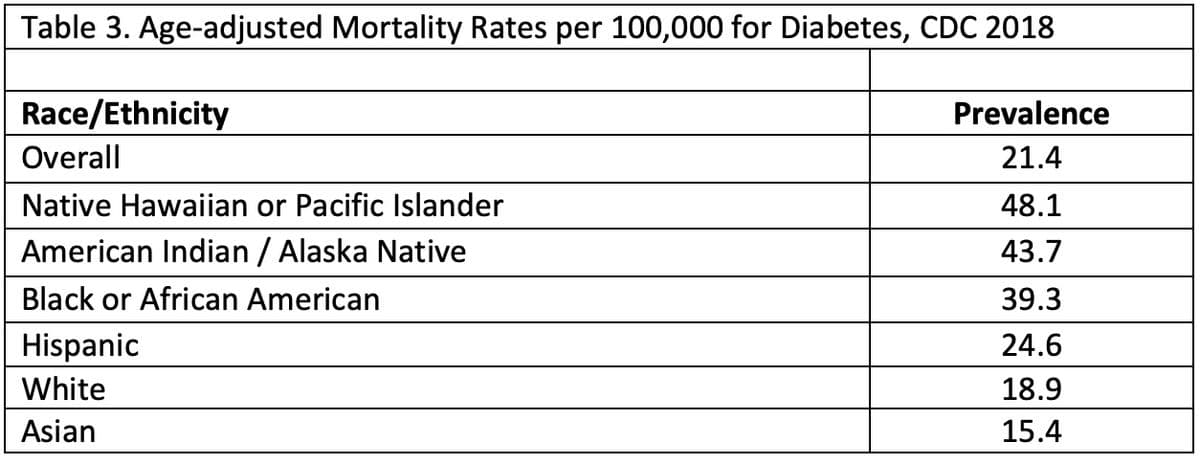
Transcribed Image Text:Table 3. Age-adjusted Mortality Rates per 100,000 for Diabetes, CDC 2018
Race/Ethnicity
Overall
Native Hawaiian or Pacific Islander
American Indian / Alaska Native
Black or African American
Hispanic
White
Asian
Prevalence
21.4
48.1
43.7
39.3
24.6
18.9
15.4
Expert Solution
This question has been solved!
Explore an expertly crafted, step-by-step solution for a thorough understanding of key concepts.

This is a popular solution!

Trending now
This is a popular solution!

Step by step
Solved in 2 steps

Knowledge Booster


Learn more about
Need a deep-dive on the concept behind this application? Look no further. Learn more about this topic, biology and related others by exploring similar questions and additional content below.Recommended textbooks for you
Nutrition Through The Life Cycle
Health & Nutrition
ISBN:
9781337919333
Author:
Brown, Judith E.
Publisher:
Cengage Learning,

Case Studies In Health Information Management
Biology
ISBN:
9781337676908
Author:
SCHNERING
Publisher:
Cengage
Nutrition Through The Life Cycle
Health & Nutrition
ISBN:
9781337919333
Author:
Brown, Judith E.
Publisher:
Cengage Learning,
Case Studies In Health Information Management
Biology
ISBN:
9781337676908
Author:
SCHNERING
Publisher:
Cengage