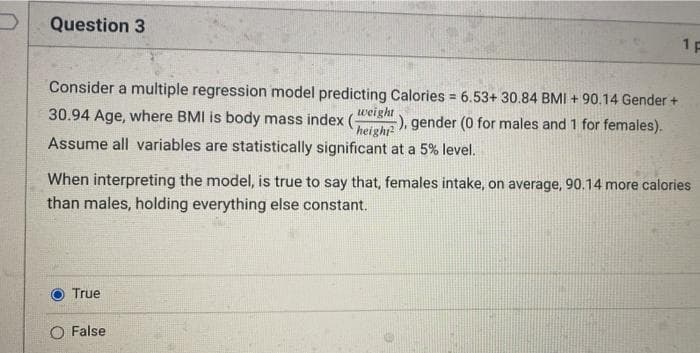
1P Consider a multiple regression model predicting Calories 6.53+ 30.84 BMI + 90.14 Gender + 30.94 Age, where BMI is body mass index (- -), gender (0 for males and 1 for females). height weight Assume all variables are statistically significant at a 5% level. When interpreting the model, is true to say that, females intake, on average, 90.14 more calories than males, holding everything else constant. True O False


Q: More cereal Exercise 1 describes a regression model thatestimates a cereal’s potassium content from…
A: In a regression analysis, the regression model describes the estimates of a cereal’s potassium…
Q: 9) Consider the hours of preparation, mid-term examination and final examination performance of 12…
A: a) Tabulate the given information as shown below, Hours of Preparation (x) 12 08 15 14 22 17 10…
Q: A software firm collected data for a sample of 30 computer programmers. A regression analysis can be…
A:
Q: Fit a linear-regression model relating annual inci- dence of diabetes to time period. (For this…
A: Regression Equation: When we want to predict the value of one variable, say Y, from the given value…
Q: A study on the efficient utilization of operating rooms was conducted. Results showed that induction…
A: In regression theory, dependent variable is the response variable, which is predicted using the…
Q: At a .05 level of significance is there sufficient evidence to conclude that the height is related…
A: Let us denote X as Height and Y as Weight Excel Procedure: Enter X and Y in Excel>Data>Data…
Q: run a simple linear regression in SPSS to determine if pulse at warm-up (The name of the variable in…
A: Check whether the regression equation is significant or not: The null and alternate hypotheses are…
Q: The model developed from sample data that has the form of Yhat = bo +b1X is known as the multiple…
A: The model developed from the sample data that has the form of y^=b0+b1×X is known as the multiple…
Q: 8. More cereal Exercise 6 describes a regression model that estimates a cereal's potassium content…
A: Given the regression model Potassium = 38+27 fiber
Q: A multiple linear regression model based on a sample of 18 weeks is developed to predict standby…
A:
Q: Define the ADL and GLS Estimators of Regression.
A:
Q: The least-squares regression equation is y=728.0x+14,705 where y is the median income and x is the…
A: From the given information, the regression equation is y=728.0x+14,705.Here, y represents the median…
Q: The following estimated regression model was developed relating yearly income (Y in $1,000s) of 30…
A:
Q: A college bookstore must order books two months before each semester starts. They believe that the…
A: (1) Use EXCEL to determine the regression equation. EXCEL procedure: Go to EXCEL Go to…
Q: The least-squares regression equation is y=647.8x+17,858 where y is the median income and x is the…
A: The regression equation is given, y= 647.8 x+17,858 y=median income x=the percentage of 25 years…
Q: We have data on Lung Capacity of persons and we wish to build a multiple linear regression model…
A: Given Information: Consider the partial result from STATISTICA.
Q: Number 5,6,7 are the number that I need help with. Thanks
A: Hello there! there are multiple questions. According to our policies we cannot answer more than one…
Q: Compute the least-squares regression equation for the given data set. Round the slope and…
A:
Q: The measure of standard error can also be applied to the parameter estimates resulting from linear…
A: Given WAGEi=β0+β1EDUCi+εi WAGEi=−11.5+6.1 EDUCi If the standard error of the estimate of β1 is 1.32,…
Q: amount of time spent at the ATM machine (SECONDS) and the gender, FEMALE (dummy variable = 1 for…
A: It is given that seconds =27.
Q: The following table gives the ages of female students in school and the corresponding Body Mass…
A: The independent variable is Age. The dependent variable is BMI. The given data represents simple…
Q: It is required to use the data given in the table to estimate the parameters of the simple linear…
A: The given data is x y 0 6 1 2 2 3 3 1 4 0 We use the method of least squares to…
Q: I proved these exercices for my econometrics class. I just want to make sure that my answer matches.…
A: Hello. Since you have posted multiple questions and not specified which question needs to be solved,…
Q: 4. Find the regression equation for predicting final score from midterm score, based on the…
A: For solution number 4 Given: y¯f=70sf=10x¯m=55sm=20r=0.60
Q: Calculate the equation of the regression line and calculate the correlation coefficient
A: Correlation is used to measure the mean significance between the two numerical variable. It take…
Q: The estimated regression equation for a model involving two independent variables and 65…
A: y^ = β0 + β1x
Q: State in algebraic notation and explain the assumption about the classical linear regression models…
A: Assumption of simple linear regression model
Q: propose a model that fulfill all five assumptions of the disturbance terms in classical linear…
A:
Q: 1. Develop a simple linear regression equation for starting salaries using an independent variable…
A: The simple linear regression equation is given by y^=β0+β1x+∈i let X be a independent variables Let…
Q: A car dealer wants to estimate the price of a used car based on the age of the car and the mileage.…
A: Solution: From the given information, the regression equation is Price = 21, 619 – 1022 Age – 0.03…
Q: The least-squares regression equation is y=620.6x+16,624 where y is the median income and x is the…
A: Given: The least-squares regression equation: y=620.6x+16,624 where, y is the median income x is…
Q: The least-squares regression equation is y=761.7x+13,208 where y is the median income and x is the…
A: The least-squares regression equation is y=761.7x+13208 The linear relation between the two…
Q: In a comprehensive road test on new car models, one variable measured is the time it takes a car to…
A: The regression lines are used to predict the response variable based on the effect or cause of the…
Q: Consider a linear spline with 16 knots. How many regression coefficients do you estimate when…
A: Given information: The regression model is a linear spline with 16 knots.
Q: 1) The population regression function for the 2-variable model is Y,= B, + B,X, +U, Where Ui is used…
A: Given information: No. of variables in model=2Model, Yi=B0+B1X1+UiSurrogate variable=Ui
Q: A group of scientists are interested in finding out whether the days of rainfall during the dry…
A: We use regression analysis to predict a dependent variable using independent random variable.
Q: 2. Let kids denote the number of children ever born to a woman, and let educ denotes years of…
A: Here, kids = B0 + B1educ + u
Q: The measure of standard error can also be applied to the parameter estimates resulting from linear…
A: The true value of b1 must lie between (coefficient estimate - standard error, coefficient estimate +…
Q: (a) Without using any software, construct a simple linear regression model for the above data. (b)…
A:
Q: A college bookstore must order books two months before each semester starts. They believe that the…
A: Hello! As you have posted more than 3 sub parts, we are answering the first 3 sub-parts. In case…
Q: The coefficients in a distributed lag regression of Y on X and its lags can be interpreted as the…
A: Time series data provide the possibility to estimate the time path of the effect on Y of a change in…
Q: Consider a multiple regression model predicting Calories 6.53+ 30.84 BMI + 90.14 Gender + 30.94 Age,…
A: HERE REGRESSION EQUATION CONTAINS 3 DEPENDED VARIABLE AGE,BMI INDEX, AND GENDER. BUT FOR THIS CASE…
Q: 6- The objective of OLS regression is to find the best fitting model to describe the relationship…
A:
Q: The least-squares regression equation is y=620.6x+16,624 where y is the median income and x is the…
A: Given: The least-squares regression equation is y=620.6x+16,624. Y- median income. x- percentage of…
Q: Suppose an appliance manufacturer is doing a regression analysis, using quarterly time-series data,…
A: a) The causes of autocorrelation are: Bias in the data The data is not reliable there must be some…
Q: The trip rate (y) and the corresponding household sizes (x) from a sample are shown in Table Q2.…
A: Simple linear regression model: A simple linear regression model is given as y^ = b0 + bx + e…
Q: What is the slope of the least-squares regression line for these data? Carry your intermediate…
A:

Step by step
Solved in 2 steps with 1 images

- What does the y -intercept on the graph of a logistic equation correspond to for a population modeled by that equation?QUESTION 4 Based on the regression equation, we can measure the pearson correlation coefficient predict the value of the dependent variable given a value of the independent variable measure the association between two variables predict the value of the independent variable given a value of the dependent variable.QUESTION 7 Estimate the population regression model. TestScore-B+B STR+English+(STR x English) + where English is the percentage of English Learners in school district i. Using the estimation results we wish to test the hypothesis below. H: The effect on test score of class size does NOT depend on the percentage of English learners. Choose the correct statement on the estimation results and/or hypothesis testing a. Since the OLS estimate is not significant at the 5% level, we should reject H Ob. The sample correlation coefficient between English and the interaction term (STRX English) is greater than 0.98. Thus, we should drop English or (STRX English) to avoid perfect multicollinearity. Oc. The p-value for testing His between 0.01 and 0.05. d. We cannot reject H at the 5% significance level. e. We cannot test Hbecause we do not include in the model the dummy variable for school districts with a high proportion of English learners 0
- Consider a hypothetical regression predicting if someone will be married or not by the age of 40, MARRIED? (1 means this person is married by the age of 40 and 0 means this person is not married by the age of 40). The regression is as follows (all variables are statistically significant): MARRIED? = 0.2 + 0.03*EDUCATION - 0.01*BMI Where EDUCATION is the number of years of education someone's had and BMI is their body mass index. Suppose someone had 20 years of education and a BMI of 25. What is the predicted value of MARRIAGE? 0.35, which makes sense even though MARRIED? can only be a zero or one 0, because the calculated value is 0.35 so we round down. 0.55, which makes sense even though MARRIED? can only be a zero or one. Calculating a predicted value should not be done here because the dependent variable is a dummy variable. 1, because the calculated value is 0.55 so we round up.Consider a hypothetical regression predicting if someone will be married or not by the age of 40, MARRIED? (1 means this person is married by the age of 40 and 0 means this person is not married by the age of 40). The regression is as follows (all variables are statistically significant): MARRIED? = 0.2 + 0.03*EDUCATION - 0.01*BMI Where EDUCATION is the number of years of education someone's had and BMI is their body mass index. Suppose someone had 20 years of education and a BMI of 25. What is the predicted value of MARRIAGE? a 0, because the calculated value is 0.35 so we round down. b 0.55, which makes sense even though MARRIED? can only be a zero or one. c 0.35, which makes sense even though MARRIED? can only be a zero or one d Calculating a predicted value should not be done here because the dependent variable is a dummy variable. e 1, because the calculated value is 0.55 so we round up.Consider a hypothetical regression predicting if someone will be married or not by the age of 40, MARRIED? (1 means this person is married by the age of 40 and 0 means this person is not married by the age of 40). The regression is as follows (all variables are statistically significant): MARRIED? = 0.2 + 0.03*EDUCATION - 0.01*BMI Where EDUCATION is the number of years of education someone's had and BMI is their body mass index. Suppose someone had 20 years of education and a BMI of 25. Complete this sentence: For every additional year of education someone has:... a ...their chance of getting married by 40 increases by 0.03 percentage points. b ...their chance of getting married by 40 increases by 3 percentage points. c ...their chance of getting married by 40 increases by 0.03. d ...their chance of getting married by 40 increases by 3%. e This regression means nothing because the dependent variable is a dummy variable.
- Consider a hypothetical regression predicting if someone will be married or not by the age of 40, MARRIED? (1 means this person is married by the age of 40 and 0 means this person is not married by the age of 40). The regression is as follows (all variables are statistically significant): MARRIED? = 0.2 + 0.03*EDUCATION - 0.01*BMI Where EDUCATION is the number of years of education someone's had and BMI is their body mass index. Suppose someone had 20 years of education and a BMI of 25.The estimated regression equation for a model involving two independent variables and 10 observations follows.The plot presents some results for a simple linear regression analysis between two variables. (IMG 1) Is it true to say that the linear correlation coefficient is 0.6839? this is true or false?
- Section 10.2 Question #7 Listed below are systolic blood pressure measurements (in mm Hg) obtained from the same woman. Find the regression equation, letting the right arm blood pressure be the predictor (x) variable. Find the best predicted systolic blood pressure in the left arm given that the systolic blood pressure in the right arm is 85mm Hg. Use a significance level of 0.05. Right Arm 103 102 96 79 79 Left Arm 174 167 147 143 145 View the critical values of the Pearson correlation coefficient r Data table Dialog content starts Critical Values of the Pearson Correlation Coefficient r n α=0.05 α=0.01 NOTE: To test H0: ρ=0 against H1: ρ≠0,reject H0 if the absolute value of r is greater than the critical value in the table. 4 0.950 0.990 5 0.878 0.959 6 0.811 0.917 7 0.754 0.875 8 0.707 0.834 9 0.666 0.798 10 0.632 0.765 11 0.602 0.735 12 0.576…Question #6 Listed below are altitudes (thousands of feet) and outside air temperatures (°F) recorded during a flight. Find the (a) explained variation, (b) unexplained variation, and (c) indicated prediction interval. There is sufficient evidence to support a claim of a linear correlation, so it is reasonable to use the regression equation when making predictions. For the prediction interval, use a 95% confidence level with the altitude of 6327 ft (or 6.327 thousand feet). Altitude 4 8 14 24 27 31 32 Temperature 55 37 20 −5 −27 −41 −57 a. Find the explained variation. ______________ (Round to two decimal places as needed.) b. Find the unexplained variation. _______________ (Round to five decimal places as needed.) c. Find the indicated prediction interval. _____________°F < y < ____________ °F (Round to four decimal places as needed.)If the coefficient of determination of a simple regression equation is 0.81, the correlation coefficient is
