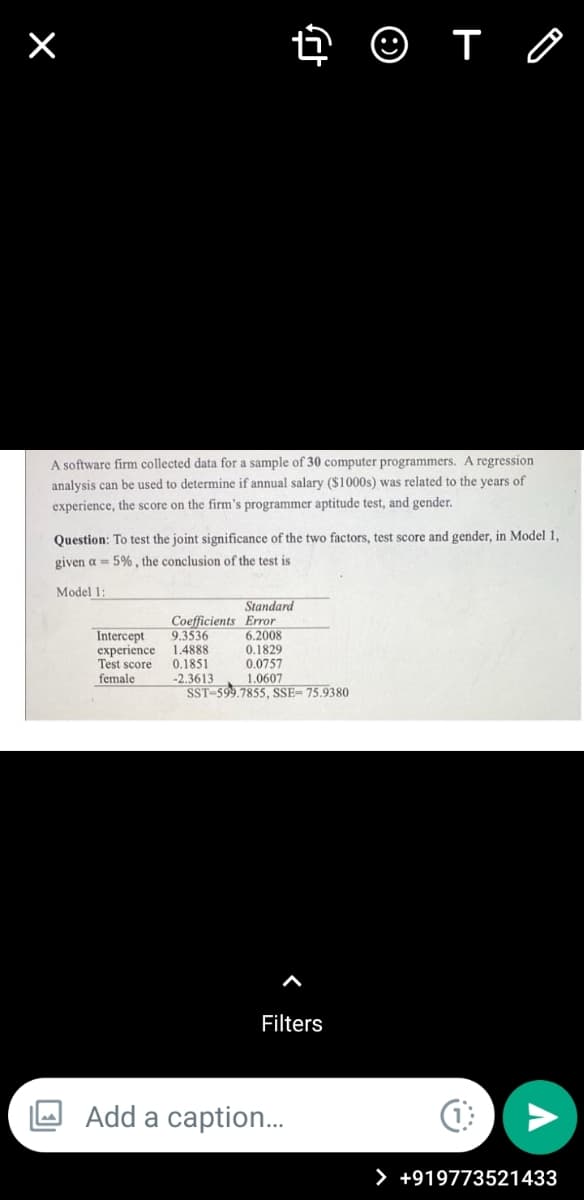
A software firm collected data for a sample of 30 computer programmers. A regression analysis can be used to determine if annual salary ($1000s) was related to the years of experience, the score on the firm's programmer aptitude test, and gender. Question: To test the joint significance of the two factors, test score and gender, in Model 1, given a - 5%, the conclusion of the test is Model 1: Standand


Q: 11. The middle number when the number in a set of data is arranged in ascending order 12. The number…
A: We need to answer:- 11. The middle number when the number in a set of data is arranged in ascending…
Q: Suppose the P-value in a two-tailed test is 0.0134. Based on the same population, sample and null…
A:
Q: Separate random samples of male and female college professors are taken. We wish to compare the…
A:
Q: 2. Describe the steps involved in ARMA model selection (focus mainly on model identification and…
A:
Q: a) Use your graphing calculator to construct and interpret a 95% confidence interval for the mean…
A: Calculate the Sample Mean and Sample Stannard deviation using Excel
Q: 0<x<y<o, S(x, y)=: 0, elsewhere. (a) Find the moment generating function. (b) Find the Cov(X, Y).
A:
Q: Assume that a procedure yields a binomial distribution with a trial repeated n=5n=5 times. Use some…
A: Givenn=5p=0.841x~Binomial(n=5,p=0.841)P(X=k)=(nk)×pk×(1-p)n-k ; x=0,1,2,3,4,5...n
Q: Problem 5 (15 points): The vaccine can be purified by one of three different machines: Machine A,…
A: Given that, The vaccine can be purified by one of three different machines: Machine A, Machine B, or…
Q: Question * Given the continuous random variables X and Y with joint probability density function:…
A:
Q: A sample of 10 students were surveyed and their pulse rates before and after exercise were recorded.…
A: There are two dependent samples which are After and Before. We have to test whether the pulse rate…
Q: 1. Provide a point estimate for the mean drying time. Assuming that the measurements represent a…
A: It is given that Sample size n = 15 Population SD = 1.14 The critical value of Z at 95% confidence…
Q: You run a regression analysis on a bivariate set of data (n=15). You obtain the regression…
A:
Q: Using your calculator, find the range and standard deviation, round to two decimals places: The…
A:
Q: Weekly Allowances Frequency (in pesos) 500 – 549 450-499 400 – 449 350-399 (f) 2 3 3
A: The represent weekly allowances
Q: Find the value of z so that the area under the standard normal curve c. between o to x is 0.4332
A:
Q: The National Center for Health Statistics has found that there is a 0.4196 chance that an American…
A: Complementary probability needed
Q: The table below gives the number of seasons that each of the main six colors of Power Range appeared…
A: The bar graph is displayed in the below step.
Q: Suppose that Y1, Y2, ... , Yn constitute a random sample from the distribution: fly|0) = { ( 1/O^2 )…
A:
Q: 10. The following data were drawn from a hypothetical sample of 1100 adults. Use a 0.05 significance…
A: We have to perform Chi-square independence test. Hypothesis : H0 : The political affiliation and…
Q: 771 Mainers participated in an automated survey performed by Public Policy Polling while voting.62%…
A:
Q: Provide an appropriate response. Based on findings from the Health and Nutrition Examination Survey…
A:
Q: used data from the Social Security records to study the average monthly benefit for a specific year…
A: Given, Sample size retired, n1= 63 Sample size disabled, n2=60 Mean benefit retired, x1=$960.50 Mean…
Q: Estimate the value of IQR for a large SRS (simple random sample) of a random variable following a…
A: IQR is based on two quartiles, first quartile and third quartile. IQR stands for interquartile…
Q: Let X be a random variable with probabilities as shown in Table 3.7. Table 3.7 Values of X and P(x)…
A:
Q: What percentage of the sample were female drivers?
A: It is given that Total = 5+7+11+9 = 32 Number of females = 7+9 = 16
Q: V Use the given data below to answer item numbers 30 to 39. m Class Interval 50-54 4. 45-49 3 5.7…
A: For the given frequency distributi4on table, we need to answer the following:4 30. The range: 31.…
Q: The U.S. Census Bureau conducts annual surveys to obtain information on the percentage of the…
A: There are two independent samples which are employed persons and unemployed persons. We have to find…
Q: Part B: Communication 1. Define the correlation coefficient? And use line provided to briefly…
A: Statistics is the branch of Mathematics in which we do collection, analysis, interpretation and…
Q: A medical researcher says that less than 25% of U.S. adults are smokers. In a simple random sample…
A: Given that, a medical researcher says that less than 25% of U.S. adults are smokers. In a simple…
Q: 8. The table depicted below lists randomly selected students' self-reported hours of studying (x)…
A: On performing data analysis we got,
Q: The joint distribution of the random variable X and Y is given in the following table: X 1 2 3 4 Y 1…
A:
Q: Find the value of the test statistic. The value of the test statistic is ___ ( round to two…
A:
Q: Calculate the p-value for the following conditions and determine whether or not to reject the null…
A: The value of test statistic and level of significance are given. We have to find the p-value. We…
Q: For a cooking oil company, the price they are paid for coconuts in large shipments is based on the…
A: It is given that a sample of n coconut can be taken and y1, . . . , yn denotes the amount of coconut…
Q: 1 2 2
A: Year Quarter Sales 1 1 9.4 1 2 7.54 1 3 2 1 4 4.69 2 5 9 2 6 8.2 2 7 6.66 2 8 5.83…
Q: An employee claims that 20% of the email she receives is personal, 60% is work related, and 20% is…
A: Given data An employee claims that 20% of the email she receives is personal 60% is work related and…
Q: X P(x) 0.15 1 0.25 2 0.3 3 0.3 Find the standard deviation of this probability distribution. Give…
A:
Q: Find the value of z so that the area under the standard normal curve d. between x to 1.96 is 0.5
A:
Q: In a study about learning styles, researchers used a group of 64 elementary school students who…
A: In a study about learning styles, researchers used a group of 64 elementary school students who…
Q: S(z|4, A) = () the statistics `X and 1=E in ent and complete. , show that X has an inverse Gaussian…
A: *Answer:
Q: Dayer diagnostics claims that their latest imaging equipment can identify signs of dementia with…
A: Solution Dayer diagnostics claims that their latest imaging equipment can identify signs of dementia…
Q: Mr. Tan built an ARIMA model to fit the price of fund XYZ. The parameter estimates he obtained are…
A: Given:
Q: 3. Consider the following dataset: 8 22 23 38 38 52 79 91 Find the percentile…
A:
Q: 28. The mode of the distribution is 29. The range of the distribution is 27. The median of the…
A: Ans - Given data 4, 4, 5, 6, 9, 9, 9, 12, 13, 14, 14 Find the mean, median, mode…
Q: The summary statistics for a certain set of points are: n = 25, s̟ = 2.50, E (x-x)* = 250.12, and b,…
A: Given datan=25se=2.50∑(x-x¯)2=250.12b1=2.15c.i=98%
Q: Assume that the averages are jointly normally distributed. (a) Find a regression line relating the…
A: “Since you have posted a question with multiple sub-parts, we will solve the first three sub-parts…
Q: Test the claim that the proportion of people who own cats is smaller than 10% at the 0.025…
A:
Q: Express the confidence interval 37.8 % ± 3.8 % in the form of a trilinear inequality. % <p <
A: We have to express the confidence interval from given data..
Q: The average retirement age in America is 64 years old. Do small business owners retire at a…
A: For the given data Perform t test for one sample mean
Q: Consider the following (x. y) data. X -4 -3 -1 00 1 -3 -2 -2 -1 1 2 2 y0 -2.65 2.65 -3.46 3.46 -3.87…
A: INTRODUCTION : Correlation Coefficient: The correlation coefficient is the measure of the degree…


Trending now
This is a popular solution!

Step by step
Solved in 2 steps with 2 images

- Would someone familiar with SPSS be able to help me complete the table and the questions? (a) Explain which of the variables have statistically significant effects at the α = 0.05 level. (b) Are the conclusions different to the results obtained by univariate regression? Explain why and which approach is likely to be preferable?In reading the results of a multiple regression analysis that contained 4 predictor variables, the researcher noticed a column labeled Beta. Two of the Beta’s were positive and two were negative. He concluded that a.) Beta’s that were positive were statistically significant b.) Beta’s that were positive had more of an effect c.) Beta’s that were positive were associated with increases in the criterion variable d.) Beta’s that were positive did not affect the criterion because they were “controlled for…”Give an example of a research question that would be suitable for computing a: a) Correlation coefficient b) Regression line
- A study is conducted to determine if there is a relationship between the two variables, blood haemoglobin (Hb) levels and packed cell volumes (PCV) in the female population. A simple linear regression analysis was performed using SPSS. Based on the SPSS output of the ANOVA table, which of the following statements is the CORRECT interpretation? 1. The regression model statistically significantly predicts the blood haemoglobin level. 2. About 39.98 % of variance in Hb is explained by PCV. 3. The regression model does not fit the data. 4. There is significant contribution of Hb towards PCV.Based on data in Figure 1, using Microsoft Excel, at 90% confidence level, can we conclude that on average, the no. of cases reported after 6/6/2021 is significantly lower than before 6/6/2021? Use the p-value approach to make your conclusion. R-naught is a measure used to describe the spreading rate of the COVID-19 disease. Based on the data in Figure 1, run a regression analysis with the aid Microsoft Excel and explain if no. of cases significantly influences the R-naught value.A research department of an American automobile company wants to develop a model topredict gasoline mileage (measured in MPG) of the company’s vehicles by using theirhorsepower and weights (measured in pounds). To do this, it took a random sample of 50vehicles to perform a regression analysis as follows: SUMMARYOUTPUTRegression StatisticsMultiple R 0.865689R Square 0.749417Adjusted RSquare 0.738754Standard Error 4.176602Observations 50ANOVAdf SS MS FRegression a 2451.973702 1225.987 dResidual b 819.8680976 cTotal 49 3271.8418CoefficientsStandardError t StatIntercept 58.15708 2.658248208 21.87797Horsepower -0.11753 0.032643428 -3.60028Weight -0.00687 0.001401173 -4.90349(a) State the multiple regression equation. Interpret the meanings of the coefficients forhorsepower and weight.(b) Test the validity of this multiple regression equation at the significance level of 1%. Showyour reasoning.(c) The research department claims that the weight of the vehicle is negatively linearly related…
- State the large-sample distribution of the instrumental variables estimator for the simple linear regression model, and how it can be used for the construction of interval estimates and hypothesis tests.A study was conducted to see whether heart rate (y) on swimmers linearly related to their age (x1) and swimming time for 2000 meters (x2). A random sample of ten swimmers was selected and the result is shown in the following Microsoft Excel output. (a)Interpret the value of R2 from the output. (b)Conduct a hypothesis test to test whether the linear regression model is fit or not using a = 0.05. (c)Calculate the 95% confidence interval for the coefficient value for age.A study was conducted to see whether heart rate (y) on swimmers linearly related to their age (x1) and swimming time for 2000 meters (x2). A random sample of ten swimmers was selected and the result is shown in the following Microsoft Excel output. (a) Interpret the value of R2 from the output. (b) Conduct a hypothesis test to test whether the linear regression model is fit or not using a = 0.05. (c) Calculate the 95% confidence interval for the coefficient value for age.
- A researcher developed a regression model to predict the cost of a meal based on the summated rating (sum of ratings for food, decor,and service) and the cost per meal for 12 restaurants. The results of the study show that b1=1.4379 and Sb1=0.1397. a. At the 0.05 level of significance, is there evidence of a linear relationship between the summated rating of a restaurant and the cost of a meal? b. Construct a 95% confidence interval estimate of the population slope, β1. a. Determine the hypotheses for the test. Choose the correct answer below. A. H0: β1=0 H1: β1≠0 B. H0: β0≤0 H1: β0>0 C. H0: β1≤0 H1: β1>0 D. H0: β0≥0 H1: β0<0 E. H0: β1≥0 H1: β1<0 F. H0: β0=0 H1: β0≠0 Compute the test statistic. The test statistic is ? (Round to two decimal places as needed.) Determine the critical value(s). The critical value(s) is(are) ? (Use a comma to separate answers as needed.…The director of an obesity clinic in a large northwestern city believes that drinking soft drinks contribute to obesity in children. To determine whether a relationship exists between these two variables, she conducts the following pilot study. Eight- 12-year-old male volunteers are randomly selected from children attending a local junior high school. Parents of the children are asked to monitor the number of soft drinks consumed by their child over a one week period. The children are weighed at the end of the week and their weights converted into body mass index (BMI) values. The BMI is a common index used to measure obesity and takes into account both height and weight. An individual is considered obese if they have a BMI value 30. The following data or collected: child. # of soft drinks consumed BMI 1 3 20 2 1 18 3…A consumer buying cooperative tested the effective heating area of 20 differentelectric space heaters with different wattages. Here are the results. a. Compute the correlation between the wattage and heating area. Is there a direct oran indirect relationship?b. Conduct a test of hypothesis to determine if it is reasonable that the coefficient isgreater than zero. Use the .05 significance level.c. Develop the regression equation for effective heating based on wattage.d. Which heater looks like the “best buy” based on the size of the residual?