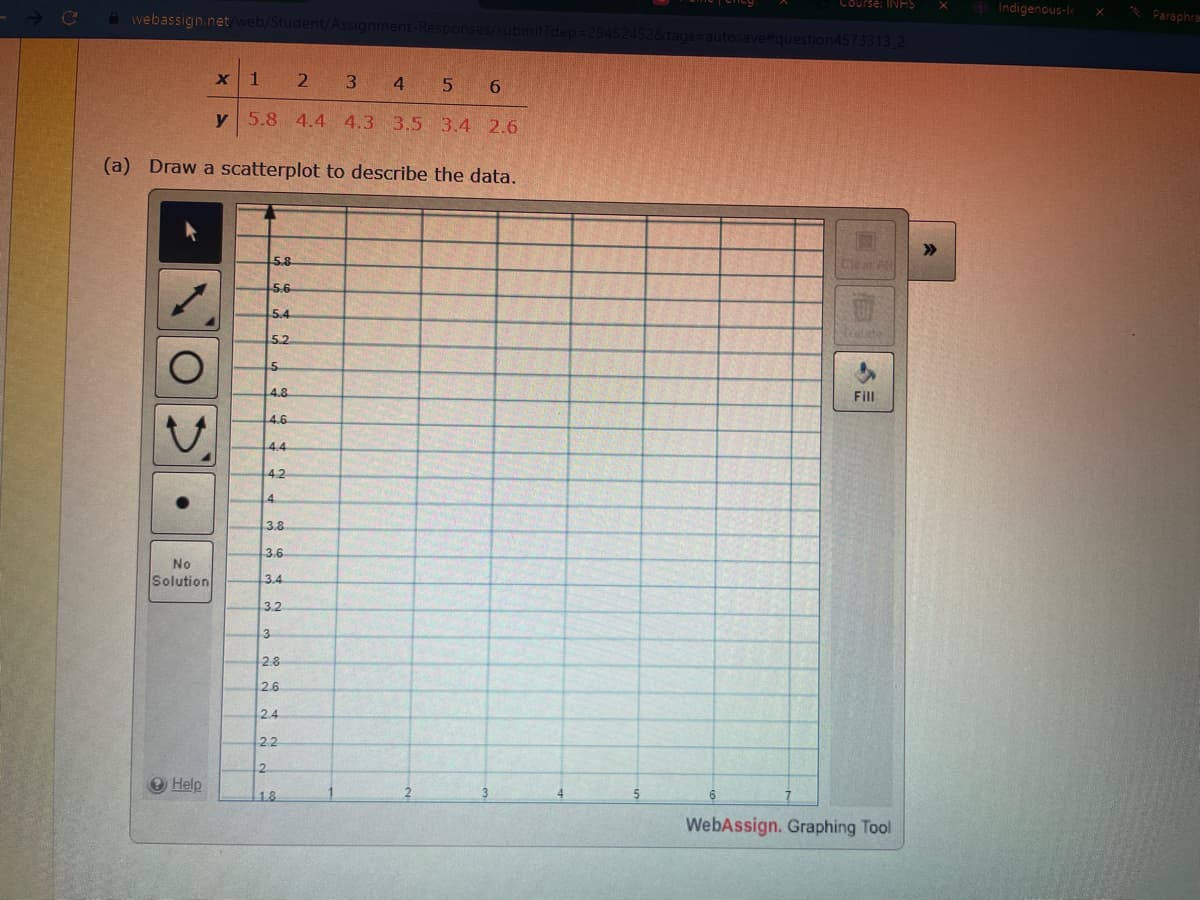
2 3 4 y 5.8 4.4 4.3 3.5 X 1 5 6 3.4 2.6

MATLAB: An Introduction with Applications
6th Edition
ISBN:9781119256830
Author:Amos Gilat
Publisher:Amos Gilat
Chapter1: Starting With Matlab
Section: Chapter Questions
Problem 1P

Related questions
Question
100%
Consider this set of bivariate data.
x 1 2 3 4 5 6
y 5.8 4.4 4.3 3.5 3.4 2.6
Draw a scatter (!REFER TO PICTURE AND GRAPH ACCORDING TO THIS!)
(b) Does there appear to be a relationship between x and y? If so, how do you describe it?
A. Yes, there appears to be a positive relationship between x and y. As x increases, y increases.
B. Yes, there appears to be a negative relationship between x and y. As x increases, y decreases.
C. No, there is no relationship between x and y.
(c) Calculate the correlation coefficient , r. (Round your answer to two decimal places.)
r =
Does the value of r confirm your conclusions in part (b)? Explain.
Yes, the value of r indicates a strong negative relationship between x and y.
Yes, the value of r indicates no relationship between x and y.
Yes, the value of r indicates a strong positive relationship between x and y.
No, the value of r indicates no relationship between x and y.
No, the value of r indicates a strong negative relationship between x and y.
Transcribed Image Text:webassign.net/web/Student/Assignment-Responses/submit?dep=29452452&tags=autosave#question4573313_2
X 1 2 3 4 5 6
y 5.8 4.4 4.3 3.5
3.4 2.6
(a) Draw a scatterplot to describe the data.
●
No
Solution
→ Help
5.8
5.6
5.4
5.2
5
4.8
4.6
4.4
4.2
4
3
3.8
3.6
3.4
3.2
2.8
2.6
2.4
2.2
2
Course: INHS
18
Dear All
Fill
WebAssign. Graphing Tool
Indigenous-le
X
Paraphra
Expert Solution
This question has been solved!
Explore an expertly crafted, step-by-step solution for a thorough understanding of key concepts.

Step by step
Solved in 2 steps with 3 images

Recommended textbooks for you
MATLAB: An Introduction with Applications
Statistics
ISBN:
9781119256830
Author:
Amos Gilat
Publisher:
John Wiley & Sons Inc

Probability and Statistics for Engineering and th…
Statistics
ISBN:
9781305251809
Author:
Jay L. Devore
Publisher:
Cengage Learning

Statistics for The Behavioral Sciences (MindTap C…
Statistics
ISBN:
9781305504912
Author:
Frederick J Gravetter, Larry B. Wallnau
Publisher:
Cengage Learning
MATLAB: An Introduction with Applications
Statistics
ISBN:
9781119256830
Author:
Amos Gilat
Publisher:
John Wiley & Sons Inc
Probability and Statistics for Engineering and th…
Statistics
ISBN:
9781305251809
Author:
Jay L. Devore
Publisher:
Cengage Learning
Statistics for The Behavioral Sciences (MindTap C…
Statistics
ISBN:
9781305504912
Author:
Frederick J Gravetter, Larry B. Wallnau
Publisher:
Cengage Learning

Elementary Statistics: Picturing the World (7th E…
Statistics
ISBN:
9780134683416
Author:
Ron Larson, Betsy Farber
Publisher:
PEARSON

The Basic Practice of Statistics
Statistics
ISBN:
9781319042578
Author:
David S. Moore, William I. Notz, Michael A. Fligner
Publisher:
W. H. Freeman

Introduction to the Practice of Statistics
Statistics
ISBN:
9781319013387
Author:
David S. Moore, George P. McCabe, Bruce A. Craig
Publisher:
W. H. Freeman