2 answer and choose one (right-tailed, left-tailed, two-tailed) 2) critical value 3) t=
2 answer and choose one (right-tailed, left-tailed, two-tailed) 2) critical value 3) t=

Glencoe Algebra 1, Student Edition, 9780079039897, 0079039898, 2018
18th Edition
ISBN:9780079039897
Author:Carter
Publisher:Carter
Chapter10: Statistics
Section10.5: Comparing Sets Of Data
Problem 4CYU

Related questions
Question
see pictures (question 1-3)
1) 2 answer and choose one (right-tailed, left-tailed, two-tailed)
2) critical value
3) t=
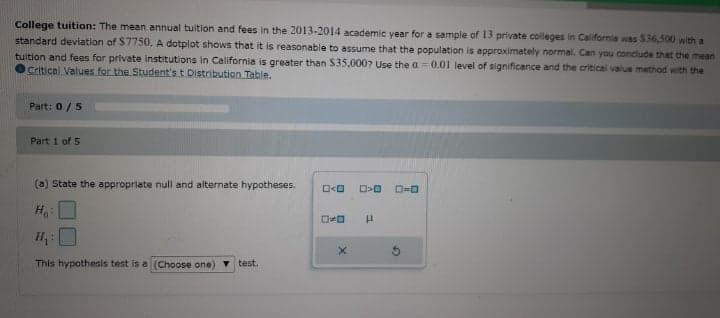
Transcribed Image Text:College tuition: The mean annual tultion and fees in the 2013-2014 academic year for a sample of 13 private colleges in California was $36,500 with a
standard deviation of $7750. A dotplot shows that it is reasonable to assume that the population is approximately normal. Can you conclude that the mean
tuition and fees for private institutions in California is greater than $35.000? Use the a = 0.01 level of significance and the critical value method with the
Critical Values for the Student's t Distribution Table.
Part: 0/5
Part 1 of 5
(a) State the appropriate null and alternate hypotheses.
Ho
H.
This hypothesis test is a (Choose one) test.
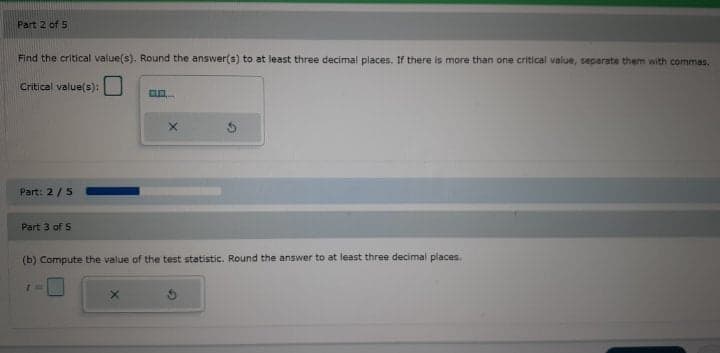
Transcribed Image Text:Part 2 of 5
Find the critical value(s). Round the answer(s) to at least three decimal places. If there is more than one critical value, separate them with commas.
Critical value(s):
Part: 2 /5
Part 3 of 5
(b) Compute the value of the test statistic. Round the answer to at least three decimal places.
Expert Solution
This question has been solved!
Explore an expertly crafted, step-by-step solution for a thorough understanding of key concepts.

Step by step
Solved in 2 steps with 1 images

Recommended textbooks for you
Glencoe Algebra 1, Student Edition, 9780079039897…
Algebra
ISBN:
9780079039897
Author:
Carter
Publisher:
McGraw Hill
Glencoe Algebra 1, Student Edition, 9780079039897…
Algebra
ISBN:
9780079039897
Author:
Carter
Publisher:
McGraw Hill