/2 (d) Will the researcher reject the null hypothesis? O A. No, because the test statistic does not fall in the critical region. O B. No, because the test statistic falls in the critical region. O c. Yes, because the test statistic does not fall in the critical region. O D. Yes, because the test statistic falls in the critical region.
/2 (d) Will the researcher reject the null hypothesis? O A. No, because the test statistic does not fall in the critical region. O B. No, because the test statistic falls in the critical region. O c. Yes, because the test statistic does not fall in the critical region. O D. Yes, because the test statistic falls in the critical region.

MATLAB: An Introduction with Applications
6th Edition
ISBN:9781119256830
Author:Amos Gilat
Publisher:Amos Gilat
Chapter1: Starting With Matlab
Section: Chapter Questions
Problem 1P

Related questions
Question
Question 4
Answer part D only!!
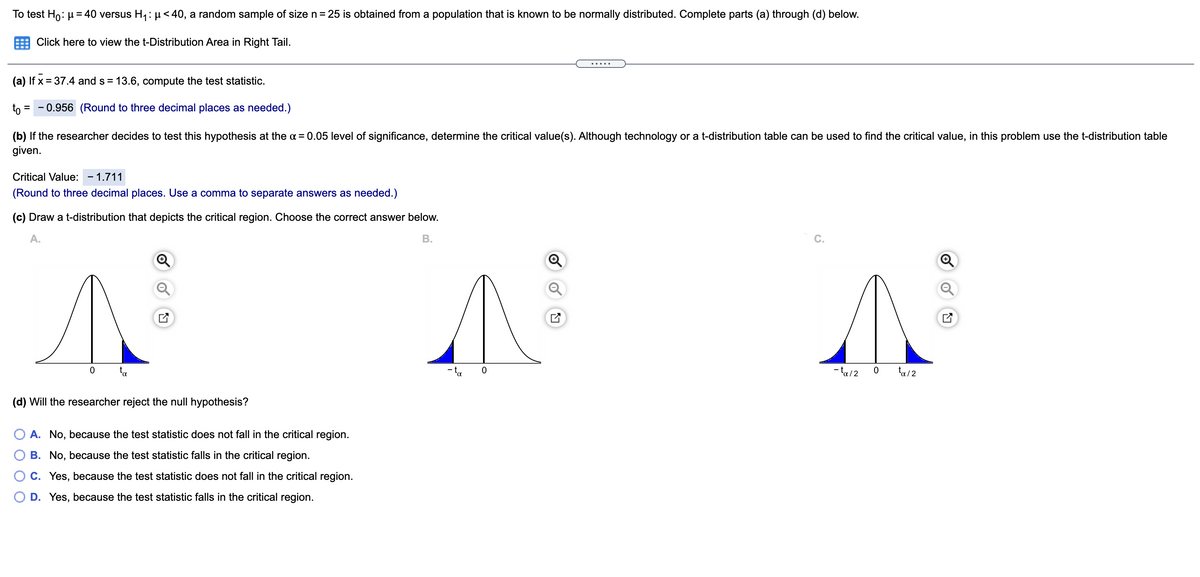
Transcribed Image Text:To test Ho: µ= 40 versus H, : µ< 40, a random sample of size n = 25 is obtained from a population that is known to be normally distributed. Complete parts (a) through (d) below.
Click here to view the t-Distribution Area in Right Tail.
(a) If x = 37.4 and s = 13.6, compute the test statistic.
to=
0.956 (Round to three decimal places as needed.)
(b) If the researcher decides to test this hypothesis at the a = 0.05 level of significance, determine the critical value(s). Although technology or a t-distribution table can be used to find the critical value, in this problem use the t-distribution table
given.
Critical Value: - 1.711
(Round to three decimal places. Use
CO
hma to separate answers as needed.)
(c) Draw a t-distribution that depicts the critical region. Choose the correct answer below.
A.
В.
C.
ta
- ta
- ta/2
ta/2
(d) Will the researcher reject the null hypothesis?
O A. No, because the test statistic does not fall in the critical region.
B. No, because the test statistic falls in the critical region.
C. Yes, because the test statistic does not fall in the critical region.
O D. Yes, because the test statistic falls in the critical region.
Expert Solution
This question has been solved!
Explore an expertly crafted, step-by-step solution for a thorough understanding of key concepts.

This is a popular solution!

Trending now
This is a popular solution!

Step by step
Solved in 2 steps

Recommended textbooks for you
MATLAB: An Introduction with Applications
Statistics
ISBN:
9781119256830
Author:
Amos Gilat
Publisher:
John Wiley & Sons Inc

Probability and Statistics for Engineering and th…
Statistics
ISBN:
9781305251809
Author:
Jay L. Devore
Publisher:
Cengage Learning

Statistics for The Behavioral Sciences (MindTap C…
Statistics
ISBN:
9781305504912
Author:
Frederick J Gravetter, Larry B. Wallnau
Publisher:
Cengage Learning
MATLAB: An Introduction with Applications
Statistics
ISBN:
9781119256830
Author:
Amos Gilat
Publisher:
John Wiley & Sons Inc
Probability and Statistics for Engineering and th…
Statistics
ISBN:
9781305251809
Author:
Jay L. Devore
Publisher:
Cengage Learning
Statistics for The Behavioral Sciences (MindTap C…
Statistics
ISBN:
9781305504912
Author:
Frederick J Gravetter, Larry B. Wallnau
Publisher:
Cengage Learning

Elementary Statistics: Picturing the World (7th E…
Statistics
ISBN:
9780134683416
Author:
Ron Larson, Betsy Farber
Publisher:
PEARSON

The Basic Practice of Statistics
Statistics
ISBN:
9781319042578
Author:
David S. Moore, William I. Notz, Michael A. Fligner
Publisher:
W. H. Freeman

Introduction to the Practice of Statistics
Statistics
ISBN:
9781319013387
Author:
David S. Moore, George P. McCabe, Bruce A. Craig
Publisher:
W. H. Freeman