● ● (2) Make a frequency table to show the frequency with which you chose each response. (3) From your frequency table, calculate the proportion of your responses that were Rock, the proportion that were Paper, and the proportion that were Scissors. (4) Make a two-way table to show the relationship between your response and the outcome of each round. (5) From your two-way table, calculate the proportion of Rock responses that resulted in a win, the proportion of Paper responses that resulted in a win, and the proportion of Scissors responses that resulted in a win.
● ● (2) Make a frequency table to show the frequency with which you chose each response. (3) From your frequency table, calculate the proportion of your responses that were Rock, the proportion that were Paper, and the proportion that were Scissors. (4) Make a two-way table to show the relationship between your response and the outcome of each round. (5) From your two-way table, calculate the proportion of Rock responses that resulted in a win, the proportion of Paper responses that resulted in a win, and the proportion of Scissors responses that resulted in a win.

Linear Algebra: A Modern Introduction
4th Edition
ISBN:9781285463247
Author:David Poole
Publisher:David Poole
Chapter2: Systems Of Linear Equations
Section2.4: Applications
Problem 26EQ

Related questions
Question
The data is in the the pictures that I added
Transcribed Image Text:DIT
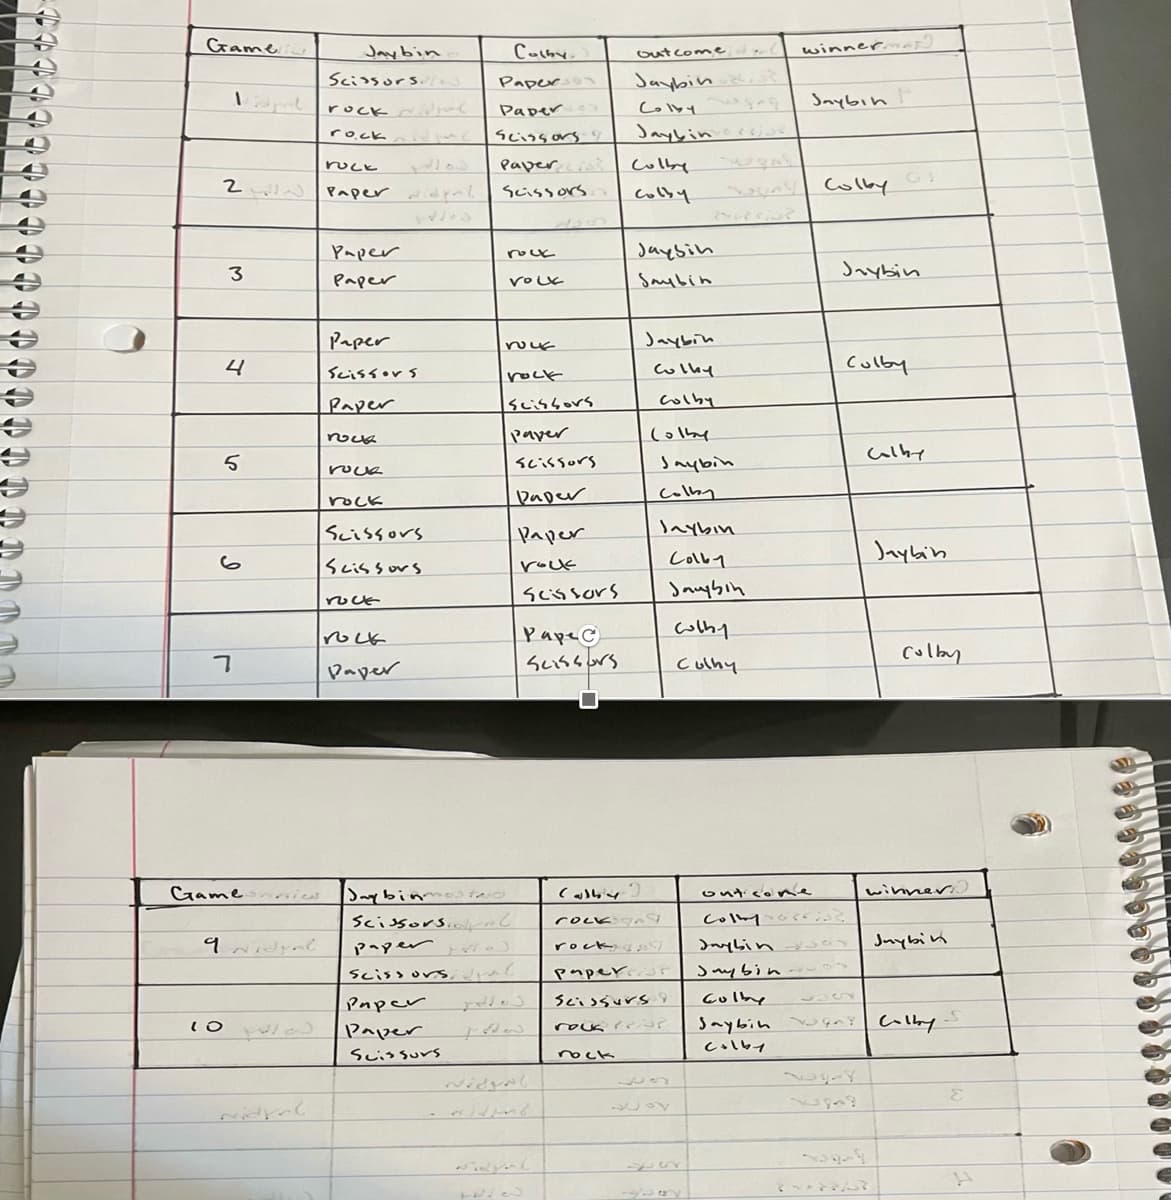
Game.
3
4
5
6
10
ruck
2 Paper widprl scissors.
7
Стате ovies
9 Nidyal
Jaybin
Scissors/
Nidruć
rock circ
rock
Paper
Paper
Paper
Scissors
Paper
поск
roce
rock
Scissors
Scissors
roce
поск
Paper
Colby
Paperson
Paper
Paper
Scissors
Paper
Scissors
Paper Colby
Colby
rock
Jaybinmos two
Scissors.
paper
Scissors,
Volk
rou
rock
scissors
paver
scissors
Paper
Paper
rock
Scissors
Pape@
Scissors
الله لو ما را
ک سوال کے کام
ب الله )
rock
rock
outcome..
Jaybin
Colby
Jaybin ise
rock
Jaysin
Saybin
2
Jaybin
Colby
Colby
Colby
Jaybin
colby
paperP
Scissurs
rockist
Jaybin
Colby
Jaybin
Jang Colby
Murcia
colby
Culhy
57
winnerAt
Jaybin
out cone
Colby
Jaybin
Jaybin
Jaybin
Colby
colby
،۰۰۰ ...
Jaybin
colby
winner
Jaybin
Colby
Jaybin gn: Colby S
colby
Transcribed Image Text:●
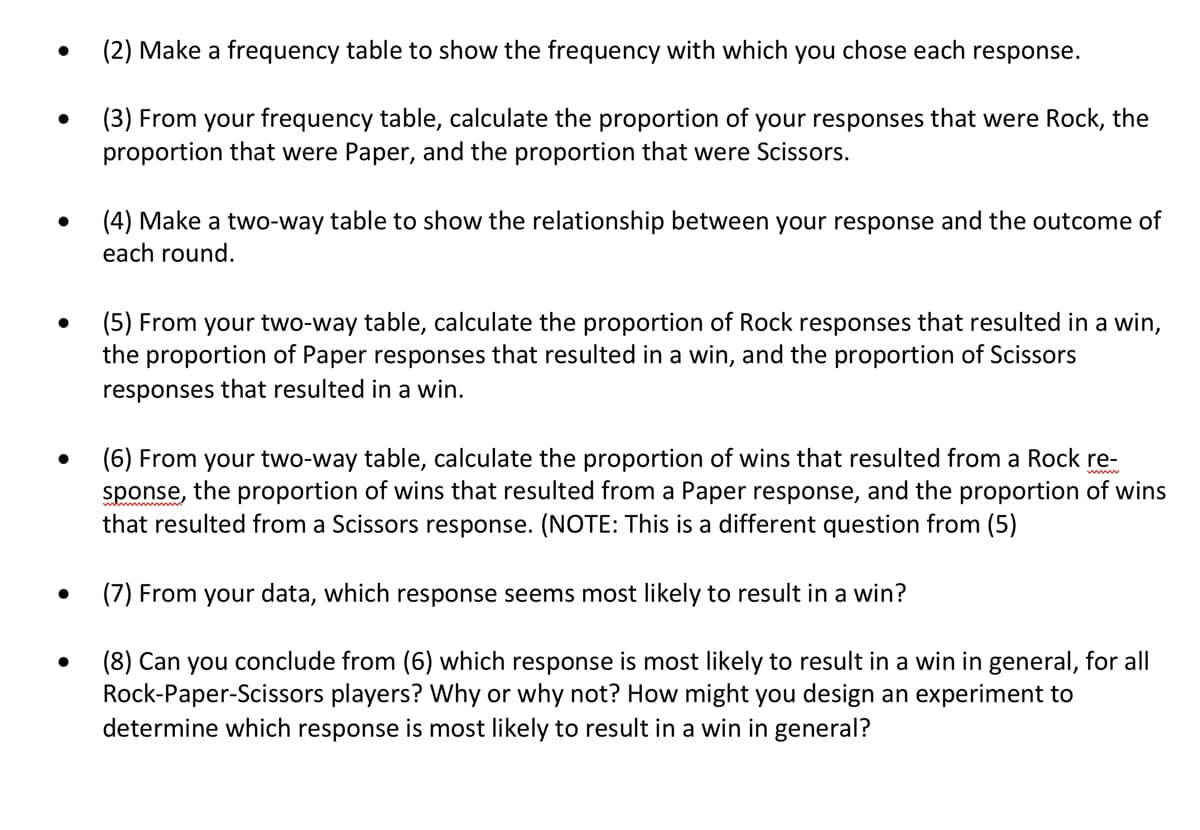
(2) Make a frequency table to show the frequency with which you chose each response.
(3) From your frequency table, calculate the proportion of your responses that were Rock, the
proportion that were Paper, and the proportion that were Scissors.
(4) Make a two-way table to show the relationship between your response and the outcome of
each round.
(5) From your two-way table, calculate the proportion of Rock responses that resulted in a win,
the proportion of Paper responses that resulted in a win, and the proportion of Scissors
responses that resulted in a win.
(6) From your two-way table, calculate the proportion of wins that resulted from a Rock re-
sponse, the proportion of wins that resulted from a Paper response, and the proportion of wins
that resulted from a Scissors response. (NOTE: This is a different question from (5)
(7) From your data, which response seems most likely to result in a win?
(8) Can you conclude from (6) which response is most likely to result in a win in general, for all
Rock-Paper-Scissors players? Why or why not? How might you design an experiment to
determine which response is most likely to result in a win in general?
Expert Solution
This question has been solved!
Explore an expertly crafted, step-by-step solution for a thorough understanding of key concepts.

Step by step
Solved in 5 steps

Recommended textbooks for you
Linear Algebra: A Modern Introduction
Algebra
ISBN:
9781285463247
Author:
David Poole
Publisher:
Cengage Learning

Algebra: Structure And Method, Book 1
Algebra
ISBN:
9780395977224
Author:
Richard G. Brown, Mary P. Dolciani, Robert H. Sorgenfrey, William L. Cole
Publisher:
McDougal Littell
Linear Algebra: A Modern Introduction
Algebra
ISBN:
9781285463247
Author:
David Poole
Publisher:
Cengage Learning
Algebra: Structure And Method, Book 1
Algebra
ISBN:
9780395977224
Author:
Richard G. Brown, Mary P. Dolciani, Robert H. Sorgenfrey, William L. Cole
Publisher:
McDougal Littell