2 students in a statistics class are categorized by gender and by the year in school. The numbers obtained are display Year in school Freshman Sophomore Junior 2. Total 31 Senior Graduate 6. 17 2. 23 17 13 7. 3. 63 24 19 22 24 5. 94 ca are going to be summarized by computing the conditional distributions of year in school for male and female stud 55
2 students in a statistics class are categorized by gender and by the year in school. The numbers obtained are display Year in school Freshman Sophomore Junior 2. Total 31 Senior Graduate 6. 17 2. 23 17 13 7. 3. 63 24 19 22 24 5. 94 ca are going to be summarized by computing the conditional distributions of year in school for male and female stud 55

Holt Mcdougal Larson Pre-algebra: Student Edition 2012
1st Edition
ISBN:9780547587776
Author:HOLT MCDOUGAL
Publisher:HOLT MCDOUGAL
Chapter11: Data Analysis And Probability
Section11.4: Collecting Data
Problem 3E

Related questions

Topic Video
Question
Can you please help me on both 9 and 10?
Transcribed Image Text:E Apps
a Amazon.com - Onli.
P Priceline.com
O TripAdvisor
O watch
Imported
A Done
Homework 2.5-2.7
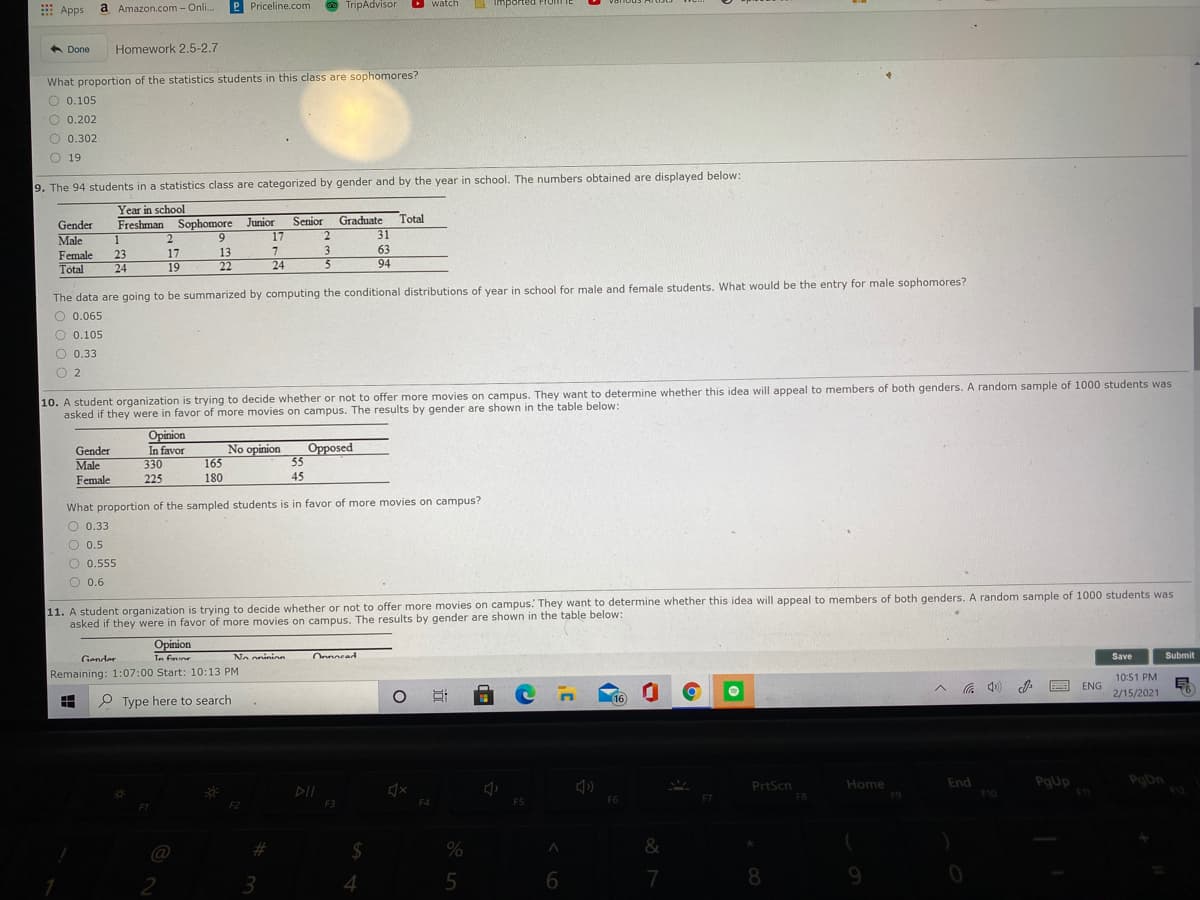
What proportion of the statistics students in this class are sophomores?
O 0.105
O 0.202
O 0.302
O 19
9. The 94 students in a statistics class are categorized by gender and by the year in school. The numbers obtained are displayed below:
Year in school
Graduate Total
2.
Junior
Senior
Sophomore
2
Gender
Freshman
Male
1
9
17
31
3.
63
13
22
Female
23
17
Total
24
19
24
94
The data are going to be summarized by computing the conditional distributions of year in school for male and female students. What would be the entry for male sophomores?
O 0.065
O 0.105
O 0.33
O 2
10. A student organization is trying to decide whether or not to offer more movies on campus. They want to determine whether this idea will appeal to members of both genders. A random sample of 1000 students was
asked if they were in favor of more movies on campus. The results by gender are shown in the table below:
Opinion
In favor
330
Opposed
55
45
Gender
No opinion
Male
165
Female
225
180
What proportion of the sampled students is in favor of more movies on campus?
O 0.33
O 0.5
O 0.555
O 0.6
11. A student organization is trying to decide whether or not to offer more movies on campus: They want to determine whether this idea will appeal to members of both qgenders. A random sample of 1000 students was
asked if they were in favor of more movies on campus. The results by gender are shown in the table below:
Opinion
Gender
Tn fne
No onininn
Onnored
Save
Submit
Remaining: 1:07:00 Start: 10:13 PM
10:51 PM
ENG
2/15/2021
P Type here to search
16
PgUp
F11
PgDn
Home
End
PrtScn
F8
F9
F10
F7
F2
F3
F4
F5
%23
&
2
3
7
8
Expert Solution
Step 1
Given,
9.)
| Gender | freshman | sophomore | junior | senior | Graduate | Total |
| Male | 1 | 2 | 9 | 17 | 2 | 31 |
| Female | 23 | 17 | 13 | 7 | 3 | 63 |
| Total | 24 | 19 | 22 | 24 | 5 | 94 |
10.)
| Gender | In favor | No opinion | opposed |
| Male | 330 | 165 | 55 |
| Female | 225 | 180 | 45 |

Trending now
This is a popular solution!

Step by step
Solved in 2 steps

Knowledge Booster


Learn more about
Need a deep-dive on the concept behind this application? Look no further. Learn more about this topic, statistics and related others by exploring similar questions and additional content below.Recommended textbooks for you
Holt Mcdougal Larson Pre-algebra: Student Edition…
Algebra
ISBN:
9780547587776
Author:
HOLT MCDOUGAL
Publisher:
HOLT MCDOUGAL

Glencoe Algebra 1, Student Edition, 9780079039897…
Algebra
ISBN:
9780079039897
Author:
Carter
Publisher:
McGraw Hill
Holt Mcdougal Larson Pre-algebra: Student Edition…
Algebra
ISBN:
9780547587776
Author:
HOLT MCDOUGAL
Publisher:
HOLT MCDOUGAL
Glencoe Algebra 1, Student Edition, 9780079039897…
Algebra
ISBN:
9780079039897
Author:
Carter
Publisher:
McGraw Hill