
MATLAB: An Introduction with Applications
6th Edition
ISBN: 9781119256830
Author: Amos Gilat
Publisher: John Wiley & Sons Inc
expand_more
expand_more
format_list_bulleted
Related questions
Concept explainers
Question
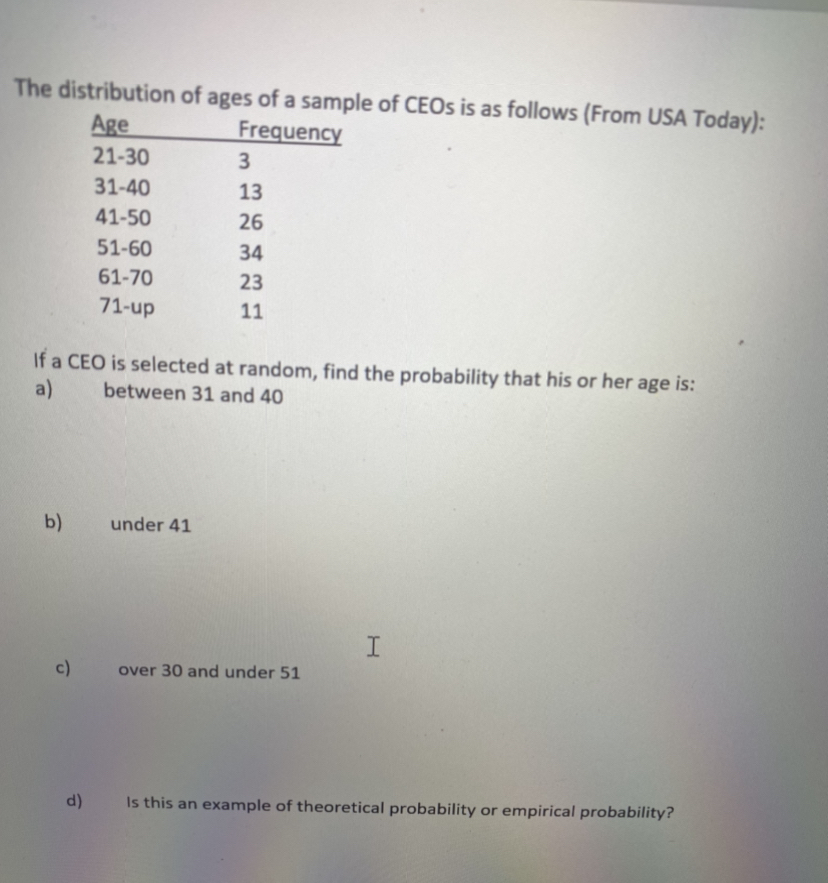

Transcribed Image Text:The distribution of ages of a sample of CEOS is as follows (From USA Today):
Age
Frequency
21-30
31-40
13
41-50
26
51-60
34
61-70
23
71-up
11
If a CEO is selected at random, find the probability that his or her age is:
a)
between 31 and 40
b)
under 41
I.
c)
over 30 and under 51
d)
Is this an example of theoretical probability or empirical probability?
Expert Solution
This question has been solved!
Explore an expertly crafted, step-by-step solution for a thorough understanding of key concepts.

This is a popular solution

Trending nowThis is a popular solution!

Step by stepSolved in 2 steps with 1 images

Knowledge Booster


Learn more about
Need a deep-dive on the concept behind this application? Look no further. Learn more about this topic, statistics and related others by exploring similar questions and additional content below.Similar questions
- According to a health publication, 15.8% of persons under the age of 65 have no health insurance coverage. Suppose that four persons under the age of 65 are randomly selected. a. Determine the probability distribution for the number, X, who have no health insurance coverage. b. Determine and interpret the mean of X. a. Complete the table below to determine the probability distribution of X. x P(X=x) 0 1 2 3 4arrow_forwardThe following indicates the probability distribution of the number of breakdowns per month for a computer based on past data. Find the probability that the number of breakdowns for this computer is at most 2. Breakdowns/month Probability 1 2 3 0.18 0.21 0.31 0.40 0.52arrow_forwardAge Age Gender Under 40 40 or Older Total Male 12 2 14 Female 8 3 11 Total 20 5 25 The table above shows the distribution of age and gender for 25 people who entered a contest. If the contest winner will be selected at random, what is the probability that the winner will be either a female or 40 or older? 13/25 16/25 3/25 10/25arrow_forward
- A box contains the following tickets: 1, 1, 1, 1, 2, 2, 3, 3. Which of the plots below represents the probability histogram for a single draw from this box? (a) (b) (c)arrow_forwardQuestion content area top left Part 1 Use the accompanying bar graph, which shows the highest level of education received by employees of a company, to find the probability that the highest level of education for an employee chosen at random is a doctoratea doctorate. ... Question content area top right Part 1 A bar graph titled Level of Education has a horizontal axis labeled Doctoral, Master's, Bachelor's, Associate's, High School diploma, and Other and a vertical axis labeled Number of employees from 0 to 40 in increments of 5. There are vertical bars, each of which is over a horizontal axis label. The heights of the bars are as follows, where the horizontal axis label is listed first and the height is listed second: Doctoral, 2; Master's, 25; Bachelor's, 32; Associate's, 24; High School diploma, 4; Other, 1. Each bar is labeled with its height. Level of education ABCDEF010203040Number of employeesA:DoctoralB:Master'sC:Bachelor'sD:Associate'sE:High School…arrow_forwardA random sample of adults was asked about their highest education level completed. The distribution of results is shown in the table. What is the probability that the highest level of education of an adult is a high school diploma, given that they have completed at least one of the education levels shown? 0.04 0.16 0.47 0.84arrow_forward
- Hospital visits: According to a health agency, there were 409,689 hosital visits for asthma-related illnesses in a recent year. The age distribution was as follows. Round your answers to four decimal places if necessary. Age Range Less than 1 year 1-17 18-44 45-64 65-84 85 and up Total Send data to Excel Part 1 of 3 (a) What is the probability that an asthma patient is between 18 and 44 years old? The probability that an asthma patient is between 18 and 44 years old is 0.1944 Part 2 of 3 (b) What is the probability than an asthma patient is less than 1 year old? The probability that an asthma patient is less than 1 year old is 0.0192 Part: 2/3 Number 7862 103,032 79,653 121,731 80,658 16,753 409,689 Part 3 of 3 (c) Using a cutoff of 0.05, is it unusual for an asthma patient to be 85 years old or older? Based on a cutoff of 0.05, it (Choose one) unusual for an asthma patient to be 85 years old or older. is is not Xarrow_forwardSuppose that Melanie is a researcher who wishes to estimate the mean birthweight of full-term babies in her hospital. What is the minimum number of babies should she sample if she wishes to be at least 90% confident that the mean birthweight of the sample is within 225 grams of the the mean birthweight of all babies? Assume that the distribution of birthweights at her hospital is normal with a standard deviation of 600 g.arrow_forwardThe following table shows the distribution of murders by type of weapon for murder cases in a particular country over the past 12 years. Complete parts (a) Handgun through (e). Weapon Probability 0.478 Rifle 0.023 Shotgun Unknown firearm Knives Hands, fists, etc. Other 0.034 0.145 0.135 0.056 0.129arrow_forward
- A recent study gave the information shown in the table about ages of children receiving toys. The percentages represent all toys sold. Age (years) Percentage of Toys 2 and under3-56-910-1213 and over 17%18%26%10%29% What is the probability that a toy is purchased for someone in the following age ranges? (a) 6 years old or older %(b) 12 years old or younger %(c) between 6 and 12 years old %(d) between 3 and 9 years old %A child between 10 and 12 years old looks at this probability distribution and asks, "Why are people more likely to buy toys for kids older than I am (13 and over) than for kids in my age group (10–12)?" How would you respond? The 13-and-older category may include children up to 17 or 18 years old. This is a larger category.The 13-and-older category may include children up to 17 or 18 years old. This is a smaller category.arrow_forwardIf a graph represents a probability distribution, then the total area under the curve is what?arrow_forward
arrow_back_ios
arrow_forward_ios
Recommended textbooks for you
- MATLAB: An Introduction with ApplicationsStatisticsISBN:9781119256830Author:Amos GilatPublisher:John Wiley & Sons Inc
 Probability and Statistics for Engineering and th...StatisticsISBN:9781305251809Author:Jay L. DevorePublisher:Cengage Learning
 Statistics for The Behavioral Sciences (MindTap C...StatisticsISBN:9781305504912Author:Frederick J Gravetter, Larry B. WallnauPublisher:Cengage Learning
  Elementary Statistics: Picturing the World (7th E...StatisticsISBN:9780134683416Author:Ron Larson, Betsy FarberPublisher:PEARSON
 The Basic Practice of StatisticsStatisticsISBN:9781319042578Author:David S. Moore, William I. Notz, Michael A. FlignerPublisher:W. H. Freeman
 Introduction to the Practice of StatisticsStatisticsISBN:9781319013387Author:David S. Moore, George P. McCabe, Bruce A. CraigPublisher:W. H. Freeman
MATLAB: An Introduction with Applications
Statistics
ISBN:9781119256830
Author:Amos Gilat
Publisher:John Wiley & Sons Inc
Probability and Statistics for Engineering and th...
Statistics
ISBN:9781305251809
Author:Jay L. Devore
Publisher:Cengage Learning
Statistics for The Behavioral Sciences (MindTap C...
Statistics
ISBN:9781305504912
Author:Frederick J Gravetter, Larry B. Wallnau
Publisher:Cengage Learning
Elementary Statistics: Picturing the World (7th E...
Statistics
ISBN:9780134683416
Author:Ron Larson, Betsy Farber
Publisher:PEARSON
The Basic Practice of Statistics
Statistics
ISBN:9781319042578
Author:David S. Moore, William I. Notz, Michael A. Fligner
Publisher:W. H. Freeman
Introduction to the Practice of Statistics
Statistics
ISBN:9781319013387
Author:David S. Moore, George P. McCabe, Bruce A. Craig
Publisher:W. H. Freeman