2 The table gives the heights, in cm, and weights, in kg, of 11 football players selected at random. Height, h cm 161 173 154 181 172 184 176 169 165 180 173 Weight, w kg 74 76 61 80 76 88 79 76 75 83 75 a Plot the points on a scatter diagram. b Calculate the coordinates of the point (h, W) and mark it on your graph. c Draw a line of best fit. d Predict the weight of a football player with height 170 cm.
2 The table gives the heights, in cm, and weights, in kg, of 11 football players selected at random. Height, h cm 161 173 154 181 172 184 176 169 165 180 173 Weight, w kg 74 76 61 80 76 88 79 76 75 83 75 a Plot the points on a scatter diagram. b Calculate the coordinates of the point (h, W) and mark it on your graph. c Draw a line of best fit. d Predict the weight of a football player with height 170 cm.

Glencoe Algebra 1, Student Edition, 9780079039897, 0079039898, 2018
18th Edition
ISBN:9780079039897
Author:Carter
Publisher:Carter
Chapter10: Statistics
Section10.6: Summarizing Categorical Data
Problem 1BGP

Related questions
Question
Please do ques and i will like your answer from 3 ids beleive me but do all the answers typed only without any plagiarism only typed pls typed
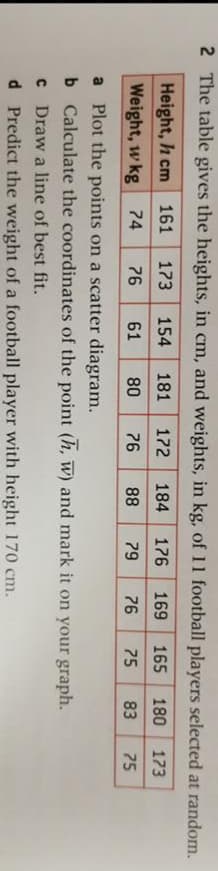
Transcribed Image Text:2 The table gives the heights, in cm, and weights, in kg, of 11 football players selected at random.
Height, h cm
161
173
154
181
172
184
176
169
165
180
173
Weight, w kg 74
76
61
80
76
88
79
76
75
83
75
a Plot the points on a scatter diagram.
b Calculate the coordinates of the point (h, W) and mark it on your graph.
Draw a line of best fit.
d Predict the weight of a football player with height 170 cm.
Expert Solution
This question has been solved!
Explore an expertly crafted, step-by-step solution for a thorough understanding of key concepts.

This is a popular solution!

Trending now
This is a popular solution!

Step by step
Solved in 3 steps with 1 images

Recommended textbooks for you
Glencoe Algebra 1, Student Edition, 9780079039897…
Algebra
ISBN:
9780079039897
Author:
Carter
Publisher:
McGraw Hill

Holt Mcdougal Larson Pre-algebra: Student Edition…
Algebra
ISBN:
9780547587776
Author:
HOLT MCDOUGAL
Publisher:
HOLT MCDOUGAL

Big Ideas Math A Bridge To Success Algebra 1: Stu…
Algebra
ISBN:
9781680331141
Author:
HOUGHTON MIFFLIN HARCOURT
Publisher:
Houghton Mifflin Harcourt
Glencoe Algebra 1, Student Edition, 9780079039897…
Algebra
ISBN:
9780079039897
Author:
Carter
Publisher:
McGraw Hill
Holt Mcdougal Larson Pre-algebra: Student Edition…
Algebra
ISBN:
9780547587776
Author:
HOLT MCDOUGAL
Publisher:
HOLT MCDOUGAL
Big Ideas Math A Bridge To Success Algebra 1: Stu…
Algebra
ISBN:
9781680331141
Author:
HOUGHTON MIFFLIN HARCOURT
Publisher:
Houghton Mifflin Harcourt

Algebra & Trigonometry with Analytic Geometry
Algebra
ISBN:
9781133382119
Author:
Swokowski
Publisher:
Cengage