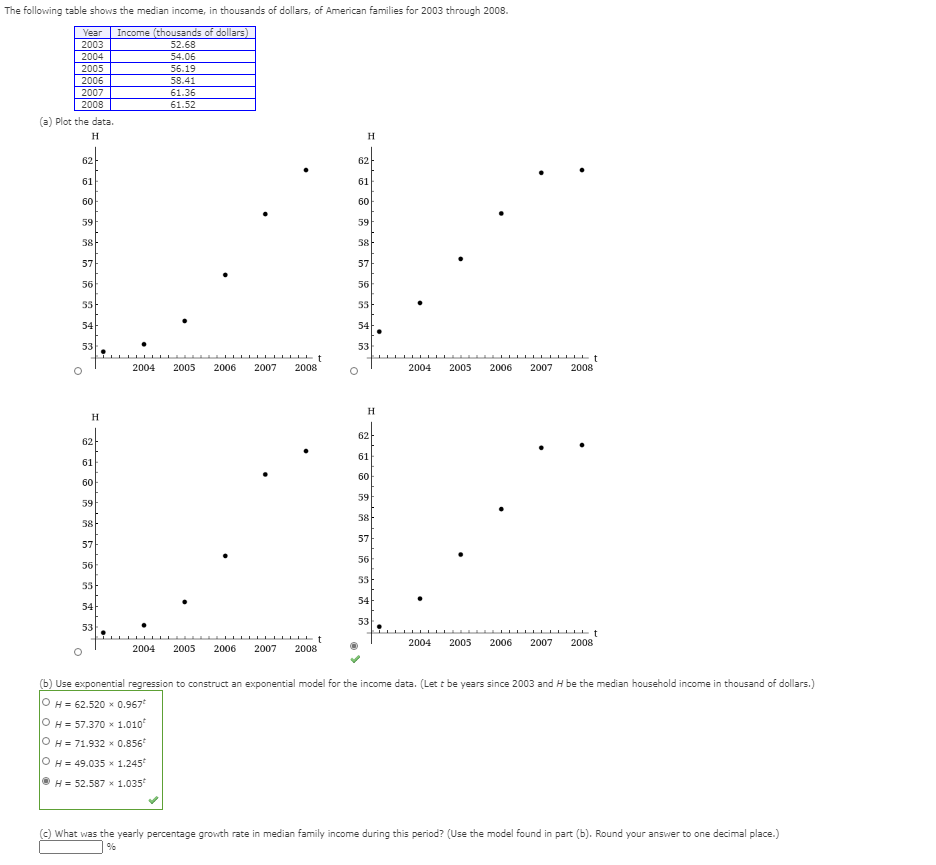
The following table shows the median income, in thousands of dollars, of American families for 2003 through 2008. Income (thousands of dollars) Vear 2003 52.68 54.06 2004 2005 56.19 2006 58.41 2007 2008 61.36 61.52 (a) Plot the data. H H 62 62 61 61 60 60 59 59 58 58 57 57 56 56 55 55 54 54 53 53 2004 2005 2006 2007 2008 2004 2005 2006 2007 2008 H. H 62 62 61 61 60 60 59 59 58 58 57 57 56 56 55 54 54 53 53 L LLLL t 2007 2004 2005 2006 2008 2004 2005 2006 2007 2008 (b) Use exponential regression to construct an exponential model for the income data. (Let t be years since 2003 and H be the median household income in thousand of dollars.) OH= 62.520 x 0.967 OH = 57.370 x 1.010 OH = 71.932 x 0.856 OH = 49.035 x 1.245 O H = 52.587 x 1.035 (c) What was the yearly percentage growth rate in median family income during this period? (Use the model found in part (b). Round your answer to one decimal place.)


Inverse Normal Distribution
The method used for finding the corresponding z-critical value in a normal distribution using the known probability is said to be an inverse normal distribution. The inverse normal distribution is a continuous probability distribution with a family of two parameters.
Mean, Median, Mode
It is a descriptive summary of a data set. It can be defined by using some of the measures. The central tendencies do not provide information regarding individual data from the dataset. However, they give a summary of the data set. The central tendency or measure of central tendency is a central or typical value for a probability distribution.
Z-Scores
A z-score is a unit of measurement used in statistics to describe the position of a raw score in terms of its distance from the mean, measured with reference to standard deviation from the mean. Z-scores are useful in statistics because they allow comparison between two scores that belong to different normal distributions.


Trending now
This is a popular solution!

Step by step
Solved in 2 steps


