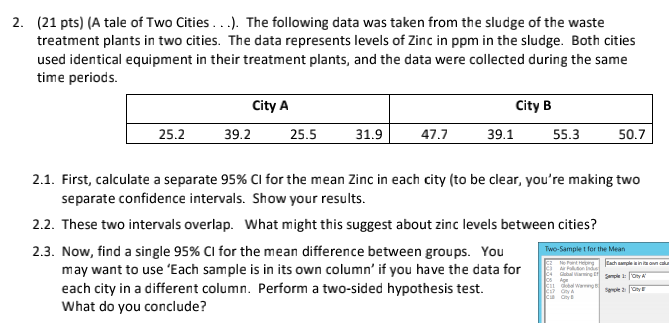
2. (21 pts) (A tale of Two Cities...). The following data was taken from the sludge of the waste treatment plants in two cities. The data represents levels of Zinc in ppm in the sludge. Both cities used identical equipment in their treatment plants, and the data were collected during the same time periods. 25.2 City A 39.2 25.5 31.9 47.7 39.1 City B 55.3 2.3. Now, find a single 95% CI for the mean difference between groups. You may want to use 'Each sample is in its own column' if you have the data for each city in a different column. Perform a two-sided hypothesis test. What do you conclude? 2.1. First, calculate a separate 95% CI for the mean Zinc in each city (to be clear, you're making two separate confidence intervals. Show your results. 2.2. These two intervals overlap. What might this suggest about zinc levels between cities? 50.7 Two-Sample for the Mean Lii
2. (21 pts) (A tale of Two Cities...). The following data was taken from the sludge of the waste treatment plants in two cities. The data represents levels of Zinc in ppm in the sludge. Both cities used identical equipment in their treatment plants, and the data were collected during the same time periods. 25.2 City A 39.2 25.5 31.9 47.7 39.1 City B 55.3 2.3. Now, find a single 95% CI for the mean difference between groups. You may want to use 'Each sample is in its own column' if you have the data for each city in a different column. Perform a two-sided hypothesis test. What do you conclude? 2.1. First, calculate a separate 95% CI for the mean Zinc in each city (to be clear, you're making two separate confidence intervals. Show your results. 2.2. These two intervals overlap. What might this suggest about zinc levels between cities? 50.7 Two-Sample for the Mean Lii

Glencoe Algebra 1, Student Edition, 9780079039897, 0079039898, 2018
18th Edition
ISBN:9780079039897
Author:Carter
Publisher:Carter
Chapter10: Statistics
Section10.6: Summarizing Categorical Data
Problem 31PPS

Related questions
Question
Transcribed Image Text:2. (21 pts) (A tale of Two Cities...). The following data was taken from the sludge of the waste
treatment plants in two cities. The data represents levels of Zinc in ppm in the sludge. Both cities
used identical equipment in their treatment plants, and the data were collected during the same
time periods.
25.2
39.2
City A
25.5
31.9
47.7
39.1
City B
55.3
2.3. Now, find a single 95% CI for the mean difference between groups. You
may want to use 'Each sample is in its own column' if you have the data for
each city in a different column. Perform a two-sided hypothesis test.
What do you conclude?
2.1. First, calculate a separate 95% CI for the mean Zinc in each city (to be clear, you're making two
separate confidence intervals. Show your results.
2.2. These two intervals overlap. What might this suggest about zinc levels between cities?
50.7
Two-Sample t for the Mean
Helping
Indus
05 Ape
C11 dobal Wang
C17 City A
Each sample is in its own cau
Sample 1: Ot
2
y
Expert Solution
This question has been solved!
Explore an expertly crafted, step-by-step solution for a thorough understanding of key concepts.

Step by step
Solved in 4 steps

Recommended textbooks for you
Glencoe Algebra 1, Student Edition, 9780079039897…
Algebra
ISBN:
9780079039897
Author:
Carter
Publisher:
McGraw Hill
Glencoe Algebra 1, Student Edition, 9780079039897…
Algebra
ISBN:
9780079039897
Author:
Carter
Publisher:
McGraw Hill