2. a) b) The following data shows the average length of new discovered species of worms code named GB52. 1.25 2.54 5.24 6.24 7.58 10.24 14.1 17.35 24.35 18.54 14.35 10.24 6.32 22.35 12.23 17.24 17.35 4.82 3.24 13.54 21.21 20.42 23.56 17.36 12.58 8.25 Organize this data in an interval frequency table with each interval having a length of 5 (starting at 0) then estimate the mean of this data using the information in the interval frequency table Calculate the standard deviation of this data (assume sample) using the table you developed in a) c) Develop Frequency histogram for this data you organized in a) and label the graph
2. a) b) The following data shows the average length of new discovered species of worms code named GB52. 1.25 2.54 5.24 6.24 7.58 10.24 14.1 17.35 24.35 18.54 14.35 10.24 6.32 22.35 12.23 17.24 17.35 4.82 3.24 13.54 21.21 20.42 23.56 17.36 12.58 8.25 Organize this data in an interval frequency table with each interval having a length of 5 (starting at 0) then estimate the mean of this data using the information in the interval frequency table Calculate the standard deviation of this data (assume sample) using the table you developed in a) c) Develop Frequency histogram for this data you organized in a) and label the graph

Glencoe Algebra 1, Student Edition, 9780079039897, 0079039898, 2018
18th Edition
ISBN:9780079039897
Author:Carter
Publisher:Carter
Chapter10: Statistics
Section10.3: Measures Of Spread
Problem 25PFA

Related questions
Question
please use one or two variable analysis to solve
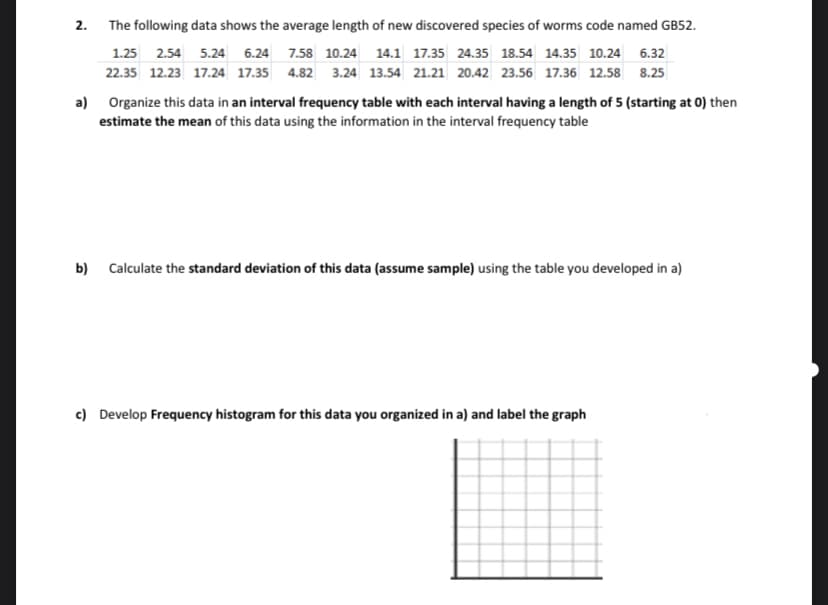
Transcribed Image Text:2.
The following data shows the average length of new discovered species of worms code named GB52.
1.25 2.54 5.24 6.24 7.58 10.24 14.1 17.35 24.35 18.54 14.35 10.24 6.32
22.35 12.23 17.24 17.35 4.82 3.24 13.54 21.21 20.42 23.56 17.36 12.58 8.25
a) Organize this data in an interval frequency table with each interval having a length of 5 (starting at 0) then
estimate the mean of this data using the information in the interval frequency table
b) Calculate the standard deviation of this data (assume sample) using the table you developed in a)
c) Develop Frequency histogram for this data you organized in a) and label the graph
Expert Solution
This question has been solved!
Explore an expertly crafted, step-by-step solution for a thorough understanding of key concepts.

Step by step
Solved in 4 steps with 1 images

Recommended textbooks for you
Glencoe Algebra 1, Student Edition, 9780079039897…
Algebra
ISBN:
9780079039897
Author:
Carter
Publisher:
McGraw Hill
Glencoe Algebra 1, Student Edition, 9780079039897…
Algebra
ISBN:
9780079039897
Author:
Carter
Publisher:
McGraw Hill