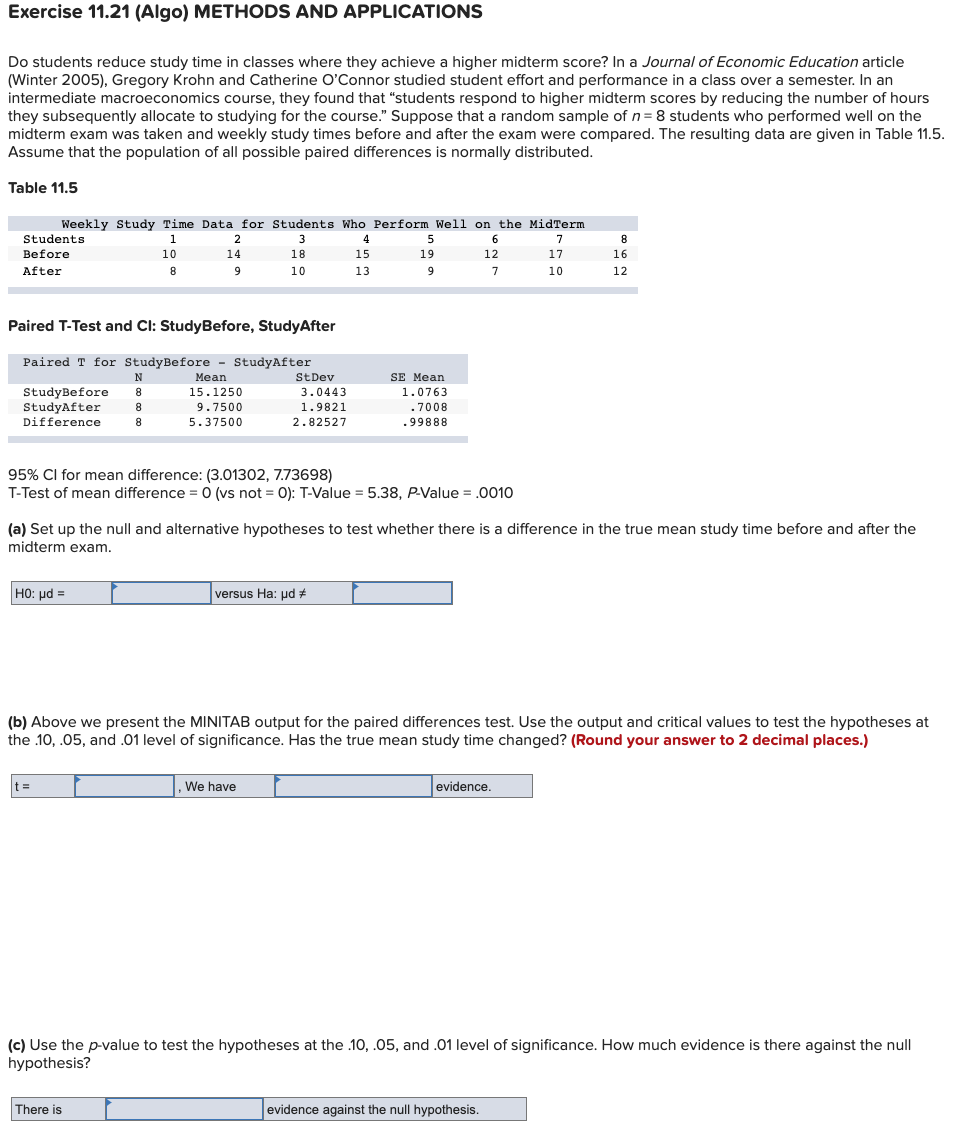
Do students reduce study time in classes where they achieve a higher midterm score? In a Journal of Economic Education article (Winter 2005), Gregory Krohn and Catherine O'Connor studied student effort and performance in a class over a semester. In an intermediate macroeconomics course, they found that "students respond to higher midterm scores by reducing the number of hours they subsequently allocate to studying for the course." Suppose that a random sample of n = 8 students who performed well on the midterm exam was taken and weekly study times before and after the exam were compared. The resulting data are given in Table 11.5. Assume that the population of all possible paired differences is normally distributed. Table 11.5 Weekly Study Time Data for Students Who Perform Well on the MidTerm 1 3 7 18 17 10 10 Students Before After N StudyBefore 8 StudyAfter 8 Difference 8 10 8 Paired T-Test and Cl: StudyBefore, StudyAfter Paired T for StudyBefore - StudyAfter Mean 15.1250 9.7500 5.37500 2 14 HO: ud = 9 There is St Dev 3.0443 1.9821 2.82527 4 versus Ha: µd # We have 15 13 5 19 9 95% CI for mean difference: (3.01302, 7.73698) T-Test of mean difference = 0 (vs not = 0): T-Value = 5.38, P.Value = .0010 SE Mean 1.0763 .7008 .99888 (a) Set up the null and alternative hypotheses to test whether there is a difference in the true mean study time before and after the midterm exam. 6 12 7 (b) Above we present the MINITAB output for the paired differences test. Use the output and critical values to test the hypotheses at the .10, .05, and .01 level of significance. Has the true mean study time changed? (Round your answer to 2 decimal places.) 8 16 12 evidence. (c) Use the p-value to test the hypotheses at the .10, .05, and .01 level of significance. How much evidence is there against the null hypothesis? evidence against the pull hypothesis
Do students reduce study time in classes where they achieve a higher midterm score? In a Journal of Economic Education article (Winter 2005), Gregory Krohn and Catherine O'Connor studied student effort and performance in a class over a semester. In an intermediate macroeconomics course, they found that "students respond to higher midterm scores by reducing the number of hours they subsequently allocate to studying for the course." Suppose that a random sample of n = 8 students who performed well on the midterm exam was taken and weekly study times before and after the exam were compared. The resulting data are given in Table 11.5. Assume that the population of all possible paired differences is normally distributed. Table 11.5 Weekly Study Time Data for Students Who Perform Well on the MidTerm 1 3 7 18 17 10 10 Students Before After N StudyBefore 8 StudyAfter 8 Difference 8 10 8 Paired T-Test and Cl: StudyBefore, StudyAfter Paired T for StudyBefore - StudyAfter Mean 15.1250 9.7500 5.37500 2 14 HO: ud = 9 There is St Dev 3.0443 1.9821 2.82527 4 versus Ha: µd # We have 15 13 5 19 9 95% CI for mean difference: (3.01302, 7.73698) T-Test of mean difference = 0 (vs not = 0): T-Value = 5.38, P.Value = .0010 SE Mean 1.0763 .7008 .99888 (a) Set up the null and alternative hypotheses to test whether there is a difference in the true mean study time before and after the midterm exam. 6 12 7 (b) Above we present the MINITAB output for the paired differences test. Use the output and critical values to test the hypotheses at the .10, .05, and .01 level of significance. Has the true mean study time changed? (Round your answer to 2 decimal places.) 8 16 12 evidence. (c) Use the p-value to test the hypotheses at the .10, .05, and .01 level of significance. How much evidence is there against the null hypothesis? evidence against the pull hypothesis

Functions and Change: A Modeling Approach to College Algebra (MindTap Course List)
6th Edition
ISBN:9781337111348
Author:Bruce Crauder, Benny Evans, Alan Noell
Publisher:Bruce Crauder, Benny Evans, Alan Noell
Chapter5: A Survey Of Other Common Functions
Section5.6: Higher-degree Polynomials And Rational Functions
Problem 5E: Population Genetics In the study of population genetics, an important measure of inbreeding is the...

Related questions
Question
Transcribed Image Text:Exercise 11.21 (Algo) METHODS AND APPLICATIONS
Do students reduce study time in classes where they achieve a higher midterm score? In a Journal of Economic Education article
(Winter 2005), Gregory Krohn and Catherine O'Connor studied student effort and performance in a class over a semester. In an
intermediate macroeconomics course, they found that "students respond to higher midterm scores by reducing the number of hours
they subsequently allocate to studying for the course." Suppose that a random sample of n = 8 students who performed well on the
midterm exam was taken and weekly study times before and after the exam were compared. The resulting data are given in Table 11.5.
Assume that the population of all possible paired differences is normally distributed.
Table 11.5
Weekly Study Time Data for Students Who Perform Well on the MidTerm
1
3
7
10
18
17
10
10
Students
Before
After
StudyBefore
StudyAfter
Difference
Paired T-Test and Cl: StudyBefore, StudyAfter
Paired T for StudyBefore - StudyAfter
Mean
15.1250
9.7500
5.37500
HO: µd =
8
N
8
8
8
t=
2
14
9
There is
St Dev
3.0443
1.9821
2.82527
4
15
13
versus Ha: ud #
, We have
5
95% CI for mean difference: (3.01302, 7.73698)
T-Test of mean difference = 0 (vs not = 0): T-Value = 5.38, P-Value = .0010
19
9
SE Mean
1.0763
.7008
.99888
(a) Set up the null and alternative hypotheses to test whether there is a difference in the true mean study time before and after the
midterm exam.
6
12
7
(b) Above we present the MINITAB output for the paired differences test. Use the output and critical values to test the hypotheses at
the .10, .05, and .01 level of significance. Has the true mean study time changed? (Round your answer to 2 decimal places.)
8
evidence.
16
12
evidence against the null hypothesis.
(c) Use the p-value to test the hypotheses at the .10, .05, and .01 level of significance. How much evidence is there against the null
hypothesis?
Expert Solution
This question has been solved!
Explore an expertly crafted, step-by-step solution for a thorough understanding of key concepts.

This is a popular solution!

Trending now
This is a popular solution!

Step by step
Solved in 2 steps

Recommended textbooks for you
Functions and Change: A Modeling Approach to Coll…
Algebra
ISBN:
9781337111348
Author:
Bruce Crauder, Benny Evans, Alan Noell
Publisher:
Cengage Learning

Linear Algebra: A Modern Introduction
Algebra
ISBN:
9781285463247
Author:
David Poole
Publisher:
Cengage Learning

Algebra & Trigonometry with Analytic Geometry
Algebra
ISBN:
9781133382119
Author:
Swokowski
Publisher:
Cengage
Functions and Change: A Modeling Approach to Coll…
Algebra
ISBN:
9781337111348
Author:
Bruce Crauder, Benny Evans, Alan Noell
Publisher:
Cengage Learning
Linear Algebra: A Modern Introduction
Algebra
ISBN:
9781285463247
Author:
David Poole
Publisher:
Cengage Learning
Algebra & Trigonometry with Analytic Geometry
Algebra
ISBN:
9781133382119
Author:
Swokowski
Publisher:
Cengage

Glencoe Algebra 1, Student Edition, 9780079039897…
Algebra
ISBN:
9780079039897
Author:
Carter
Publisher:
McGraw Hill

Big Ideas Math A Bridge To Success Algebra 1: Stu…
Algebra
ISBN:
9781680331141
Author:
HOUGHTON MIFFLIN HARCOURT
Publisher:
Houghton Mifflin Harcourt