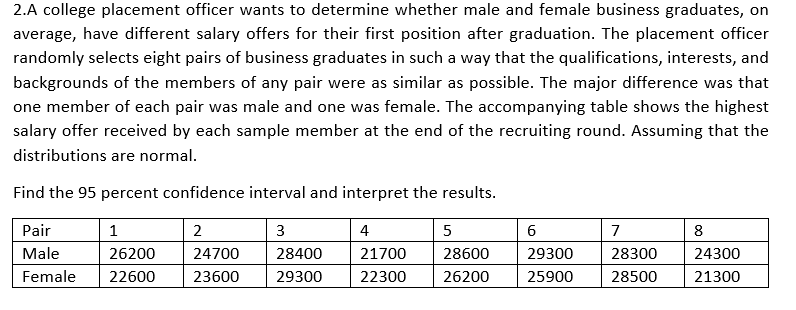
2.A college placement officer wants to determine whether male and female business graduates, on average, have different salary offers for their first position after graduation. The placement officer randomly selects eight pairs of business graduates in such a way that the qualifications, interests, and backgrounds of the members of any pair were as similar as possible. The major difference was that one member of each pair was male and one was female. The accompanying table shows the highest salary offer received by each sample member at the end of the recruiting round. Assuming that the distributions are normal. Find the 95 percent confidence interval and interpret the results. Pair 1 3 4 5 6 7 8 Male 26200 24700 28400 21700 28600 29300 28300 24300 Female 22600 23600 29300 22300 26200 25900 28500 21300
2.A college placement officer wants to determine whether male and female business graduates, on average, have different salary offers for their first position after graduation. The placement officer randomly selects eight pairs of business graduates in such a way that the qualifications, interests, and backgrounds of the members of any pair were as similar as possible. The major difference was that one member of each pair was male and one was female. The accompanying table shows the highest salary offer received by each sample member at the end of the recruiting round. Assuming that the distributions are normal. Find the 95 percent confidence interval and interpret the results. Pair 1 3 4 5 6 7 8 Male 26200 24700 28400 21700 28600 29300 28300 24300 Female 22600 23600 29300 22300 26200 25900 28500 21300

Holt Mcdougal Larson Pre-algebra: Student Edition 2012
1st Edition
ISBN:9780547587776
Author:HOLT MCDOUGAL
Publisher:HOLT MCDOUGAL
Chapter11: Data Analysis And Probability
Section11.5: Interpreting Data
Problem 1C

Related questions

Concept explainers
Contingency Table
A contingency table can be defined as the visual representation of the relationship between two or more categorical variables that can be evaluated and registered. It is a categorical version of the scatterplot, which is used to investigate the linear relationship between two variables. A contingency table is indeed a type of frequency distribution table that displays two variables at the same time.
Binomial Distribution
Binomial is an algebraic expression of the sum or the difference of two terms. Before knowing about binomial distribution, we must know about the binomial theorem.
Topic Video
Question
Transcribed Image Text:2.A college placement officer wants to determine whether male and female business graduates, on
average, have different salary offers for their first position after graduation. The placement officer
randomly selects eight pairs of business graduates in such a way that the qualifications, interests, and
backgrounds of the members of any pair were as similar as possible. The major difference was that
one member of each pair was male and one was female. The accompanying table shows the highest
salary offer received by each sample member at the end of the recruiting round. Assuming that the
distributions are normal.
Find the 95 percent confidence interval and interpret the results.
Pair
1
2
3
4
5
6
7
8
Male
26200
24700
28400
21700
28600
29300
28300
24300
Female
22600
23600
29300
22300
26200
25900
28500
21300
Expert Solution
This question has been solved!
Explore an expertly crafted, step-by-step solution for a thorough understanding of key concepts.

This is a popular solution!

Trending now
This is a popular solution!

Step by step
Solved in 2 steps with 1 images

Knowledge Booster


Learn more about
Need a deep-dive on the concept behind this application? Look no further. Learn more about this topic, probability and related others by exploring similar questions and additional content below.Recommended textbooks for you
Holt Mcdougal Larson Pre-algebra: Student Edition…
Algebra
ISBN:
9780547587776
Author:
HOLT MCDOUGAL
Publisher:
HOLT MCDOUGAL

College Algebra (MindTap Course List)
Algebra
ISBN:
9781305652231
Author:
R. David Gustafson, Jeff Hughes
Publisher:
Cengage Learning
Holt Mcdougal Larson Pre-algebra: Student Edition…
Algebra
ISBN:
9780547587776
Author:
HOLT MCDOUGAL
Publisher:
HOLT MCDOUGAL
College Algebra (MindTap Course List)
Algebra
ISBN:
9781305652231
Author:
R. David Gustafson, Jeff Hughes
Publisher:
Cengage Learning