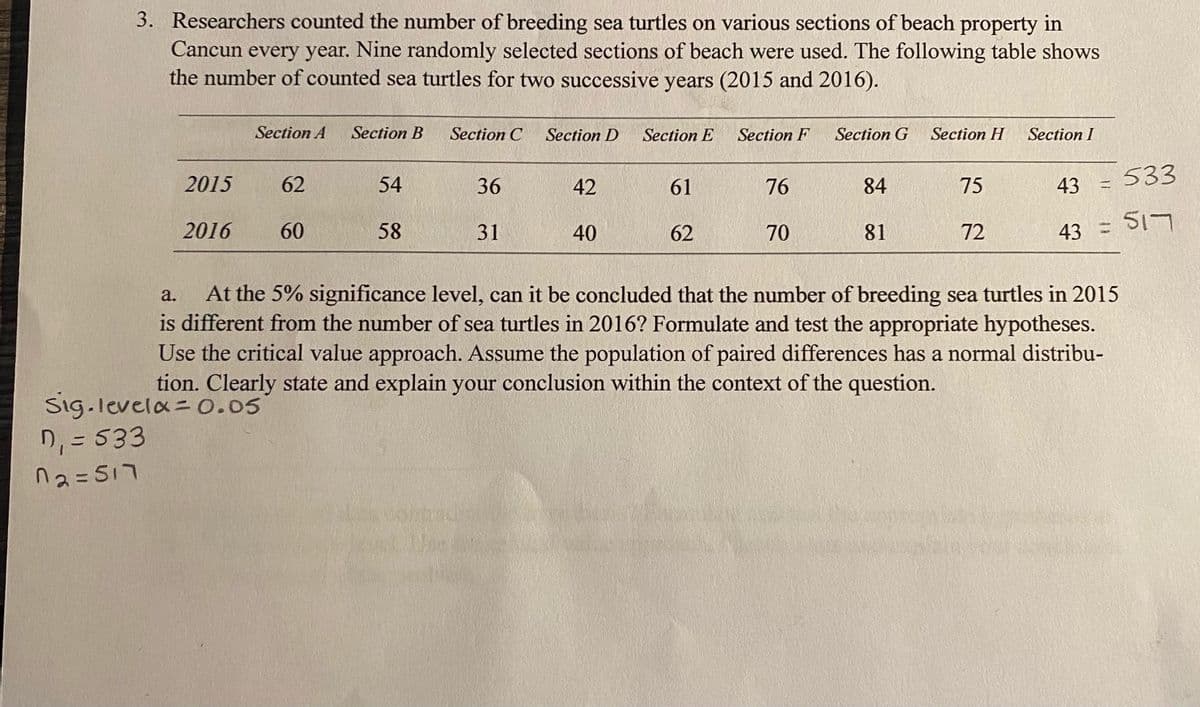
3. Researchers counted the number of breeding sea turtles on various sections of beach property in Cancun every year. Nine randomly selected sections of beach were used. The following table shows the number of counted sea turtles for two successive years (2015 and 2016). Section A Section B Section C Section D Section E Section F Section G Section H Section I 2015 62 54 75 43 = 53 36 42 61 76 84 51- 2016 60 58 31 40 62 70 81 72 43 = At the 5% significance level, can it be concluded that the number of breeding sea turtles in 2015 is different from the number of sea turtles a. 2016? Formulate and test the appropriate hypotheses. Use the critical value approach. Assume the population of paired differences has a normal distribu- tion. Clearly state and explain your conclusion within the context of the question. evela=0.05
3. Researchers counted the number of breeding sea turtles on various sections of beach property in Cancun every year. Nine randomly selected sections of beach were used. The following table shows the number of counted sea turtles for two successive years (2015 and 2016). Section A Section B Section C Section D Section E Section F Section G Section H Section I 2015 62 54 75 43 = 53 36 42 61 76 84 51- 2016 60 58 31 40 62 70 81 72 43 = At the 5% significance level, can it be concluded that the number of breeding sea turtles in 2015 is different from the number of sea turtles a. 2016? Formulate and test the appropriate hypotheses. Use the critical value approach. Assume the population of paired differences has a normal distribu- tion. Clearly state and explain your conclusion within the context of the question. evela=0.05
Holt Mcdougal Larson Pre-algebra: Student Edition 2012
1st Edition
ISBN:9780547587776
Author:HOLT MCDOUGAL
Publisher:HOLT MCDOUGAL
Chapter11: Data Analysis And Probability
Section11.5: Interpreting Data
Problem 1C
Related questions
Concept explainers
Equations and Inequations
Equations and inequalities describe the relationship between two mathematical expressions.
Linear Functions
A linear function can just be a constant, or it can be the constant multiplied with the variable like x or y. If the variables are of the form, x2, x1/2 or y2 it is not linear. The exponent over the variables should always be 1.
Question
Hi, I am having a hard time figuring out where to start for this question, and what the steps/ equation to use is. Can someone help me to figure the steps out?

Transcribed Image Text:3. Researchers counted the number of breeding sea turtles on various sections of beach property in
Cancun every year. Nine randomly selected sections of beach were used. The following table shows
the number of counted sea turtles for two successive years (2015 and 2016).
Section A
Section B
Section C
Section D
Section E
Section F
Section G
Section H
Section I
2015
62
54
36
42
61
76
84
75
43
533
%31
2016
60
43 = SI7
58
31
40
62
70
81
72
At the 5% significance level, can it be concluded that the number of breeding sea turtles in 2015
is different from the number of sea turtles in 2016? Formulate and test the appropriate hypotheses.
Use the critical value approach. Assume the population of paired differences has a normal distribu-
tion. Clearly state and explain your conclusion within the context of the question.
a.
Sig.levela= 0.05
D, = 533
na=S17
Expert Solution
This question has been solved!
Explore an expertly crafted, step-by-step solution for a thorough understanding of key concepts.
This is a popular solution!
Trending now
This is a popular solution!
Step by step
Solved in 3 steps with 1 images

Knowledge Booster
Learn more about
Need a deep-dive on the concept behind this application? Look no further. Learn more about this topic, statistics and related others by exploring similar questions and additional content below.Recommended textbooks for you

Holt Mcdougal Larson Pre-algebra: Student Edition…
Algebra
ISBN:
9780547587776
Author:
HOLT MCDOUGAL
Publisher:
HOLT MCDOUGAL

Holt Mcdougal Larson Pre-algebra: Student Edition…
Algebra
ISBN:
9780547587776
Author:
HOLT MCDOUGAL
Publisher:
HOLT MCDOUGAL