2. A nutritionist wants to know the population proportion of Grade 1 learners who eat vegetables. Pegged at a confidence of 95%, a survey among 1200 respondents was conducted and 200 said that they eat vegetables.
Q: It has been found that 1 out of every four South African drivers has at least one outstanding…
A: The probability that a randomly selected South African driver has at least one outstanding parking…
Q: L5Q5.The curve of best fit is given as y = -3 + 4x - 7x2. Find the value of y when x = -1. A.14…
A:
Q: R is a Binomially distributed Random Variable such that r~ B(10,0.4 Which of these statements are…
A: 16 Given information: R is Binomially distributed random variable with B(10, 0.4) That is, n=10 and…
Q: A professor wanted to determine whether an online homework system improved scores on a final exam.…
A:
Q: large country asked Do you pretty much think televisions are a necessity or a luxury you could do…
A: Find 95% confidence interval Select the correct choice
Q: Test the claim that the mean GPA of night students is larger than 3.2 at the 0.025 significance…
A: Consider that μ is the mean GPA of all night students.
Q: Use the Central Limit Theorem to find the mean and standard error of the mean of the sampling…
A: Given,sample size(n)=23mean(μ)=$235standard deviation(σ)=$60
Q: A poll of 1,750 people suggested that 56% of respondents regularly watch tv shows through streaming.…
A: Given,n=1750p=0.56q=1-0.56=0.44
Q: Causation is a ________________ relationship. A.physical B.mathematical C,scientific D.chemical
A: Given that - Causation is a ____________ relationship.A.physicalB.mathematicalC.scientificD.chemical
Q: . A recent survey of INTO Newcastle University students showed that 65% own an iPhone, 75% have a…
A:
Q: The college of science at a particular university has 324 alum in a given year. Each of them are…
A: Hey there! Thank you for posting the question. Since your question has more than 3 parts, we are…
Q: Question 9 A Generalised Extreme Value distribution with parameters below has been selected for…
A:
Q: Can we consider the data to be normally distributed? Explain. Calculate the sample mean and…
A: Yes we consider the data to be normally distributed Because if the data follows normal distribution…
Q: A paper suggests that the simple linear regression model is reasonable for describing the…
A: Given that
Q: Problem 4: Use R to solve this problem. Give your code with your solutions. 1- Find the 98th…
A: R programming use to write the command
Q: Which of the following distribution belongs to continuous distribution? A.The temperature at which…
A: Which of the following distribution belongs to continuous distribution?
Q: Find the median for the data items in the given frequency distribution 1 2 3 5 6 7 Score, x…
A: Using median online calculator
Q: In a random sample of five people, the mean driving distance to work was 23.2 miles and the standard…
A: Given,sample size(n)=5sample mean(x¯)=23.2standard deviation(s)=7.7degrees of…
Q: Which of the following tables shows the data in the scatter plot below? Scatter plot 100 90 80 70…
A: Scatterplot is a graphical representation between two variables, where each of the points of the…
Q: An article in Concrete Research ("Near Surface Characteristics of Concrete: Intrinsic Permeability,"…
A:
Q: Two variables are found to have r close to 0. The statement "the two variables have no relationship…
A:
Q: A researcher wishes to estimate the average blood alcohol concentration (BAC) for drivers involved…
A: Given taht mean =0.17 ,s.d =0.060 ,n=51 Find 90% confidence interval and select the correct choices
Q: Heller Manufacturing has two production facilities that manufacture baseball gloves. Production…
A:
Q: 57.5 74.3 46.4 64.7 48.1 49.6 53.3 58 63.6 42.9 58.7 47.5 49 40 49.5 57.6 48.7 65.3 57.1 49.
A: sample x (x-x̄)^2 1 65 117.2889 2 59.7 30.5809 3 59.8 31.6969 4 29.2 623.5009 5…
Q: ou wish to test the following claim (HaHa) at a significance level of α=0.001 Ho:μ=67.6…
A:
Q: (d) Use the t-test to find the standardized test statistic t t= (Type an integer or a decimal. Round…
A: For the given data Test statistic ( t ) = ?
Q: Problem 1: 1- Plot the p.d.f of Gamma(2, 2) and Gamma(3, 2) in the same plot. 2- Generate 1000…
A: Since you have posted a question with multiple sub-parts, we will solve first three subparts for…
Q: Kava is a beverage or extract that is made from Piper methysticum, a plant native to the western…
A: It is given that: p^1=0.5299, n1=402p^2=0.2322, n2=521
Q: New York Times poll found that 329 out of 763 randomly selected adults said they would travel to…
A:
Q: John is a hospital administrator who aims to reduce hospital readmission rate at the cardiology…
A: Sociology Research: The research study deals with the study of people, organizations, and other…
Q: A media report claims that the mean weekly earnings of female full-time workers in Australia was AU$…
A: * SOLUTION :- (1)
Q: Pretzels: In order to judge the effectiveness of an advertising campaign for a certain brand of…
A: Find 99.8% confidence interval for ?<p1-p2<?
Q: Digi-Key is a large distributor (but not manufacturer) of electronic components. They receive…
A:
Q: The output below shows a regression between the square footage and asking price for nine homes for…
A: Hey there! Thank you for posting the question. Since your question has more than 3 parts, we are…
Q: A department in a small firm has 50 members. The distribution of the number of coffee breaks of the…
A: Given information: c f f*c 1 11 11 2 16 32 3 23 69 Total 50 112 Average:…
Q: Check my work You want to estimate the mean family income in a rural area of central Indiana. The…
A: We have given thatStandard deviation(σ) = 500Margin of error (E) = 100Significance level (α) = 1 -…
Q: South Africa's economy posted 15 consecutive years of growth between the end of apartheid and the…
A: Given Information: No. of graphs=021st graph=GDP growth rate2nd graph=Unemployment rate
Q: Determine the area of under the Normal Curve for -0.552 52 -0.5 2 area=[a]
A: Required probability is P(-0.5≤Z≤2)
Q: Draw the scatter plot for the following data: x 100 200 300 400 500 5 25 45 65 85
A: Given data is x 100 200 300 400 500 y 5 25 45 65 85
Q: Problem 3: 1- Plot the p.d.f of Exp(1/2) and Exp(2) in the same plot. 2- Plot the c.d.f of Exp(1/2)…
A:
Q: 4. Ho: μ = 8.3 Ha: μ# 8.3 The sample mean is 9.2 and the sample size is 50. The population follows a…
A:
Q: In a certain game of chance, a wheel consists of 32 slots numbered 00, 0, 1, 2,..., 30. To play the…
A:
Q: Suppose a simple random sample of size n=50 is obtained from a population whose size is N=25,000 and…
A: It is given that N=25,000, n=50 and p=0.4.
Q: The number of stories in each of a sample of the world’s 20 tallest buildings follows. Construct a…
A: Given data is 55 80 70 79 54 56 78 77 64 60 71…
Q: Q17. R is a Normally distributed Random Variable such that r- N(10,4). Which of the following is…
A: Given that R is a normally distributed random variable Such that r~ N(10, 4) Then P(r>14) is…
Q: Next question A concrete mix is designed to withstand 3000 pounds per square inch (psi) of pressure.…
A:
Q: A random sample from a population of X with unknown mean but a known variance, o = 400, gives the…
A: b. Given information: σ2=400n=125∑xi=1750 i) Point estimate of the population mean, μ: The point…
Q: T-Distribution Statistical Abstracts (117th edition) reports that the average amount spent annually…
A: Assume that μ defines the true average amount spent annually for food by householders under 25 years…
Q: (a) The probability that 10 people have different birthdays is (Round to four decimal places as…
A: Here Given Total No of days in year=365
Q: In an experiment to investigate the performance of four different brands of spark plugs intended for…
A: For the given information, we need to fi d the value of p-value.
please answer number 2 only, but please explain each step encountered in order to solve number 2 thank you
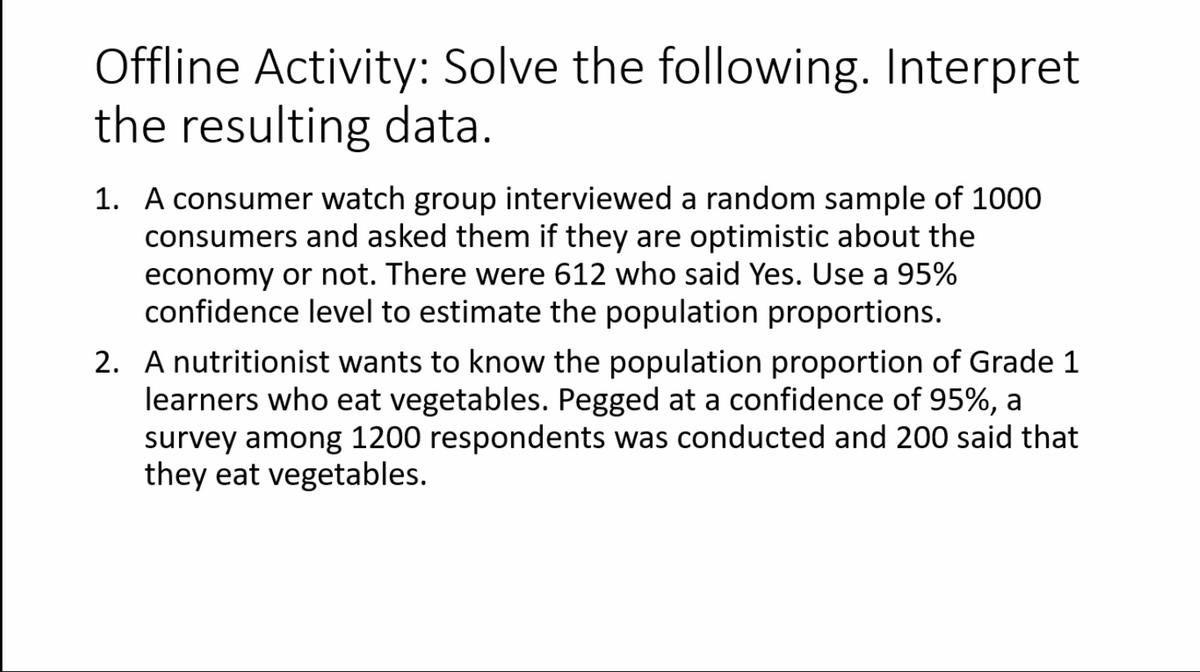
Step by step
Solved in 2 steps
- For each of the following problems, (a) Write the important information, (b) Verify the CLT conditions, (c) Calculate the margin of error and confidence interval (d) Interpret the confidence interval. According to a 2017 Gallup Poll, 617 out of 1028 randomly selected adults living in the United States felt the laws covering the sale of firearms should be more strict. Find a 95% confidence interval for the population proportion who favor stricter gun laws.For a population data set, σ=13.4. How large a sample should be selected so that the margin of error of estimate for a 95% confidence interval for μ is 3.20? Round your answer up to the nearest whole number.For a population data set, σ = 13.3 . How large a sample should be selected so that the margin of error of estimate for a 97 % confidence interval for μ is 2.50 ? Round your answer up to the nearest whole number.
- If n=310 and ˆpp^ (p-hat) =0.47, find the margin of error at a 99% confidence levelGive your answer to three decimalsRefer to the following scenario. An epidemiologist is worried about the prevalence of the flu in East Vancouver and the potential shortage of vaccines for the area. She will need to provide a recommendation for how to allocate the vaccines appropriately across the city. She takes a simple random sample of 339 people living in East Vancouver and finds that 33 have recently had the flu. Suppose that the epidemiologist wants to re-estimate the population proportion and wishes for her 95% confidence interval to have a margin of error no larger than 0.04. How large a sample should she take to achieve this? Sample size=?