The output below shows a regression between the square footage and asking price for nine homes for sale in Orange County, California in February 2010. 1800 1600 1400 1200 SUMMARY OUTPUT 1000 800 ● Multiple R 600 R Square 400 Adjusted R Square 200 Standard Error Observations 1000 2000 3000 4000 5000 6000 ANOVA SS MS F Significance F Regression 924032.3089 924032.3 33.16433 0.000692097 Residual 195035.64 27862.23 Total 8 1119067.949 Intercept SqFt -48.51516784 0.281922541 Coefficients Standard Error t Stat P-value Lower 95% Upper 95% Lower 95.0% Upper 95.0% 133.4610236 -0.36352 0.72695 -364.1003409 267.070005 -364.1003409 267.0700052 0.048954677 5.758848 0.000692 0.166163124 0.39768196 0.166163124 0.397681958 What is the regression equation? Oy - 48.52x +0.28 Oy= - - 48.52 +0.28x Oy = 48.52x +0.28 Oŷ 48.52 +0.28x Interpret the y- intercept of the line. O On average, each increase in 1 square foot of a house decreases its asking price by $48, 515. O On average, each increase in 1 square foot of a house increases its asking price by $282. Regression Statistics 0.908689165 0.825715999 0.800818284 166.9198439 9 df 1 7 0 0 ● ●
The output below shows a regression between the square footage and asking price for nine homes for sale in Orange County, California in February 2010. 1800 1600 1400 1200 SUMMARY OUTPUT 1000 800 ● Multiple R 600 R Square 400 Adjusted R Square 200 Standard Error Observations 1000 2000 3000 4000 5000 6000 ANOVA SS MS F Significance F Regression 924032.3089 924032.3 33.16433 0.000692097 Residual 195035.64 27862.23 Total 8 1119067.949 Intercept SqFt -48.51516784 0.281922541 Coefficients Standard Error t Stat P-value Lower 95% Upper 95% Lower 95.0% Upper 95.0% 133.4610236 -0.36352 0.72695 -364.1003409 267.070005 -364.1003409 267.0700052 0.048954677 5.758848 0.000692 0.166163124 0.39768196 0.166163124 0.397681958 What is the regression equation? Oy - 48.52x +0.28 Oy= - - 48.52 +0.28x Oy = 48.52x +0.28 Oŷ 48.52 +0.28x Interpret the y- intercept of the line. O On average, each increase in 1 square foot of a house decreases its asking price by $48, 515. O On average, each increase in 1 square foot of a house increases its asking price by $282. Regression Statistics 0.908689165 0.825715999 0.800818284 166.9198439 9 df 1 7 0 0 ● ●

Algebra & Trigonometry with Analytic Geometry
13th Edition
ISBN:9781133382119
Author:Swokowski
Publisher:Swokowski
Chapter7: Analytic Trigonometry
Section7.6: The Inverse Trigonometric Functions
Problem 91E

Related questions
Question
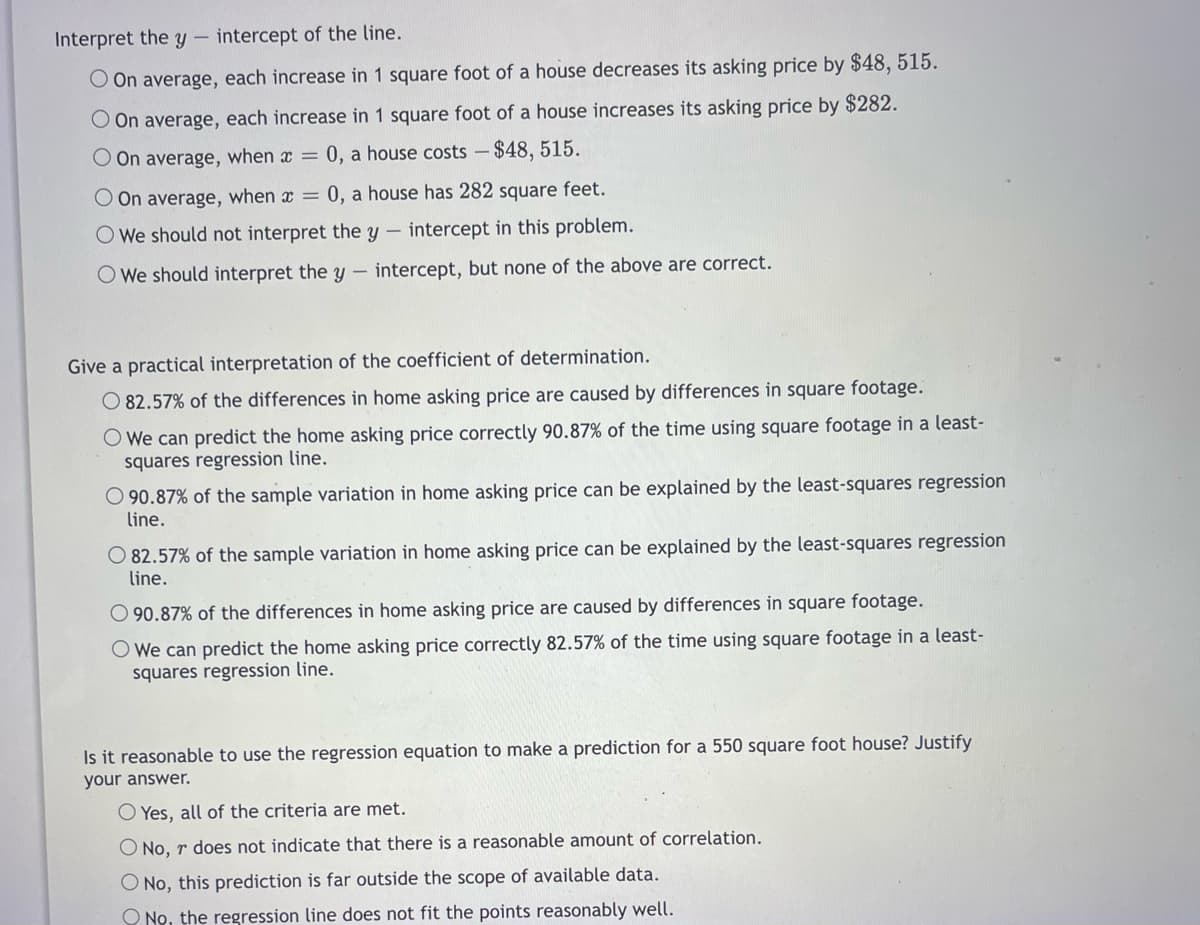
Transcribed Image Text:Interpret the y-
intercept of the line.
O On average, each increase in 1 square foot of a house decreases its asking price by $48, 515.
O On average, each increase in 1 square foot of a house increases its asking price by $282.
On average, when x = 0, a house costs - $48, 515.
O On average, when x = 0, a house has 282 square feet.
OWe should not interpret the y intercept in this problem.
-
O We should interpret the y - intercept, but none of the above are correct.
Give a practical interpretation of the coefficient of determination.
O 82.57% of the differences in home asking price are caused by differences in square footage.
O We can predict the home asking price correctly 90.87% of the time using square footage in a least-
squares regression line.
O90.87% of the sample variation in home asking price can be explained by the least-squares regression
line.
O 82.57% of the sample variation in home asking price can be explained by the least-squares regression
line.
O90.87% of the differences in home asking price are caused by differences in square footage.
O We can predict the home asking price correctly 82.57% of the time using square footage in a least-
squares regression line.
Is it reasonable to use the regression equation to make a prediction for a 550 square foot house? Justify
your answer.
O Yes, all of the criteria are met.
O No, r does not indicate that there is a reasonable amount of correlation.
O No, this prediction is far outside the scope of available data.
O No, the regression line does not fit the points reasonably well.
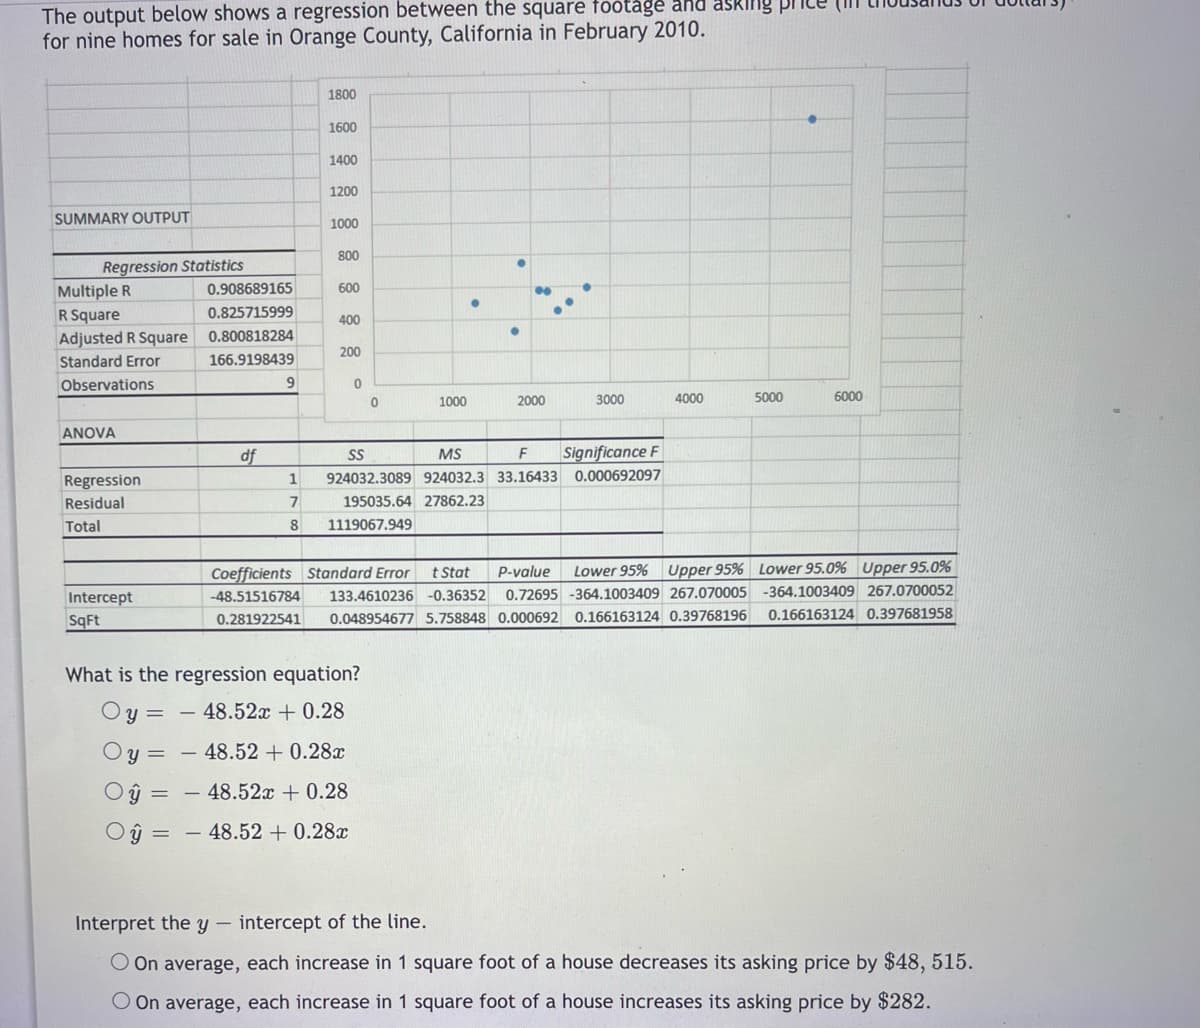
Transcribed Image Text:The output below shows a regression between the square footage and asking pr
for nine homes for sale in Orange County, California in February 2010.
1800
1600
1400
1200
SUMMARY OUTPUT
1000
800
●
Multiple R
600
R Square
400
Adjusted R Square
200
Standard Error
Observations
1000
2000
3000
5000
6000
ANOVA
SS
MS
F
Significance F
Regression
1
924032.3089 924032.3 33.16433 0.000692097
Residual
7
195035.64 27862.23
Total
8
1119067.949
Intercept
SqFt
Coefficients Standard Error t Stat P-value Lower 95% Upper 95% Lower 95.0% Upper 95.0%
-48.51516784 133.4610236 -0.36352 0.72695 -364.1003409 267.070005 -364.1003409 267.0700052
0.281922541
0.166163124 0.397681958
0.048954677 5.758848 0.000692 0.166163124 0.39768196
What is the regression equation?
Oy
=
- 48.52x +0.28
Oy
- 48.52 +0.28x
=
Oy=
- 48.52x + 0.28
Dŷ 48.52 +0.28x
=
-
Interpret the y - intercept of the line.
O On average, each increase in 1 square foot of a house decreases its asking price by $48, 515.
O On average, each increase in 1 square foot of a house increases its asking price by $282.
Regression Statistics
=
0.908689165
0.825715999
0.800818284
166.9198439
9
df
0
0
●
●
**
4000
Expert Solution
This question has been solved!
Explore an expertly crafted, step-by-step solution for a thorough understanding of key concepts.

This is a popular solution!

Trending now
This is a popular solution!

Step by step
Solved in 4 steps with 1 images

Recommended textbooks for you
Algebra & Trigonometry with Analytic Geometry
Algebra
ISBN:
9781133382119
Author:
Swokowski
Publisher:
Cengage

Glencoe Algebra 1, Student Edition, 9780079039897…
Algebra
ISBN:
9780079039897
Author:
Carter
Publisher:
McGraw Hill

Linear Algebra: A Modern Introduction
Algebra
ISBN:
9781285463247
Author:
David Poole
Publisher:
Cengage Learning
Algebra & Trigonometry with Analytic Geometry
Algebra
ISBN:
9781133382119
Author:
Swokowski
Publisher:
Cengage
Glencoe Algebra 1, Student Edition, 9780079039897…
Algebra
ISBN:
9780079039897
Author:
Carter
Publisher:
McGraw Hill
Linear Algebra: A Modern Introduction
Algebra
ISBN:
9781285463247
Author:
David Poole
Publisher:
Cengage Learning

Trigonometry (MindTap Course List)
Trigonometry
ISBN:
9781305652224
Author:
Charles P. McKeague, Mark D. Turner
Publisher:
Cengage Learning

Functions and Change: A Modeling Approach to Coll…
Algebra
ISBN:
9781337111348
Author:
Bruce Crauder, Benny Evans, Alan Noell
Publisher:
Cengage Learning

Big Ideas Math A Bridge To Success Algebra 1: Stu…
Algebra
ISBN:
9781680331141
Author:
HOUGHTON MIFFLIN HARCOURT
Publisher:
Houghton Mifflin Harcourt