2. A random sample of receipts for individuals eating at the Terrace Restaurant showed the sample mean to be X $10.39 with sample standard deviations = $2.15. (a) Use Chebyshev's Theorem to find the smallest interval centered on the mean in which we can expect at least 88.9% of the data to fall. (b) If our sample is normally distributed, what interval will contain exactly 95% of our data?
2. A random sample of receipts for individuals eating at the Terrace Restaurant showed the sample mean to be X $10.39 with sample standard deviations = $2.15. (a) Use Chebyshev's Theorem to find the smallest interval centered on the mean in which we can expect at least 88.9% of the data to fall. (b) If our sample is normally distributed, what interval will contain exactly 95% of our data?

Glencoe Algebra 1, Student Edition, 9780079039897, 0079039898, 2018
18th Edition
ISBN:9780079039897
Author:Carter
Publisher:Carter
Chapter10: Statistics
Section10.6: Summarizing Categorical Data
Problem 27PPS

Related questions
Question
I need help with this
Transcribed Image Text:sign
Layout
References
Mailings
Review
View
nd
12
A-
A-
AaßbCcDdEe
AabbCcDdEe
AaBbCcDd AaBbCcDdl AaBbCcDdEe
AalbCcDdle
AabbCcDdEe
U- abe
A-
II
Medium Grid 2
Nermal
Heading 1
Heading 2
Heading 3
Heading 4
Heading 5
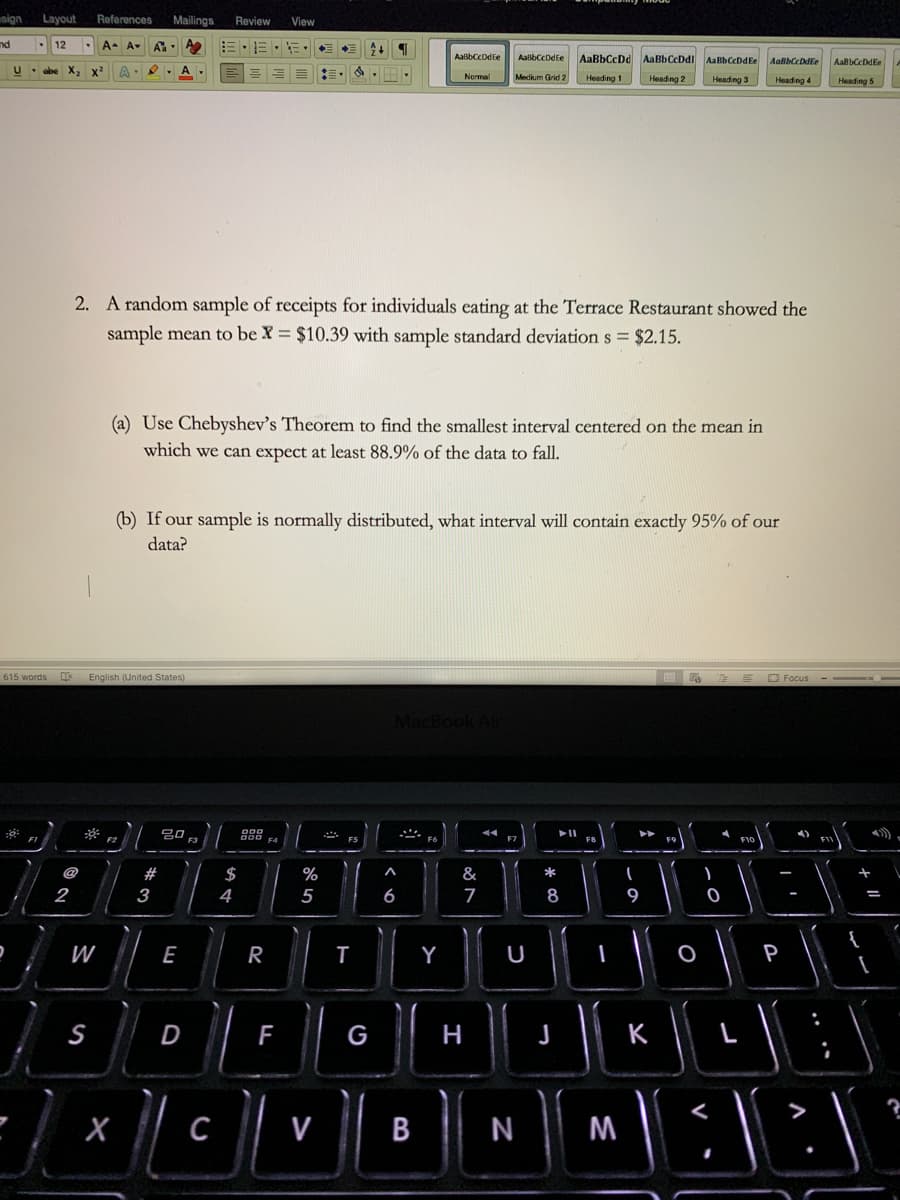
2. A random sample of receipts for individuals eating at the Terrace Restaurant showed the
sample mean to be X = $10.39 with sample standard deviation s = $2.15.
(a) Use Chebyshev's Theorem to find the smallest interval centered on the mean in
which we can expect at least 88.9% of the data to fall.
(b) If our sample is normally distributed, what interval will contain exactly 95% of our
data?
615 words
English (United States)
O Focus
Mac
吕0,
F2
F3
F7
FE
F9
@
$
%
&
*
2
3
4
5
6
8
9
W
E
R
U
P
D
F
G
H
K
C
V
В
N
M
Expert Solution
Step 1
The normal distribution is used in statistics.
Using chebyshev's theorem, atleast 1-1/K2 values lies within k standard deviations.

Trending now
This is a popular solution!

Step by step
Solved in 2 steps

Recommended textbooks for you
Glencoe Algebra 1, Student Edition, 9780079039897…
Algebra
ISBN:
9780079039897
Author:
Carter
Publisher:
McGraw Hill

Holt Mcdougal Larson Pre-algebra: Student Edition…
Algebra
ISBN:
9780547587776
Author:
HOLT MCDOUGAL
Publisher:
HOLT MCDOUGAL
Glencoe Algebra 1, Student Edition, 9780079039897…
Algebra
ISBN:
9780079039897
Author:
Carter
Publisher:
McGraw Hill
Holt Mcdougal Larson Pre-algebra: Student Edition…
Algebra
ISBN:
9780547587776
Author:
HOLT MCDOUGAL
Publisher:
HOLT MCDOUGAL