The reading speed of second grade students in a large city is approximately normal, with a mean of 92 words per minute (wpm) and a standard deviation of 10 wpm. Complete parts (a) through (f). O A. If 100 independent samples of n= 28 students were chosen from this population, we would expect sample(s) to have a sample mean reading rate of exactly 97 words per minute. O B. If 100 independent samples of n= 28 students were chosen from this population, we would expect 0 sample(s) to have a sample mean reading rate of more than 97 words per minute. OC. If 100 independent samples of n= 28 students were chosen from this population, we would expect sample(s) to have a sample mean reading rate of less than 97 words per minute. (d) What effect does increasing the sample size have on the probability? Provide an explanation for this result. O A. Increasing the sample size decreases the probability because o; increases as n increases. B. Increasing the sample size decreases the probability because o; decreases as n increases. OC. Increasing the sample size increases the probability because o; decreases as n increases. O D. Increasing the sample size increases the probability because o; increases as n increases. (e) A teacher instituted a new reading program at school. After 10 weeks in the program, it was found that the mean reading speed of a random sample of 20 second grade students was 94.7 wpm. What might you conclude based on this result? Select the correct choice below and fill in the answer boxes within your choice. (Type integers or decimals rounded to four decimal places as needed.) O A. A mean reading rate of 94.7 wpm is unusual since the probability of obtaining a result of 94.7 wpm or more is . This means that we would expect a mean reading rate of 94.7 or higher from a population whose mean reading rate is 92 in of every 100 random samples of size n= 20 students. The new program is abundantly more effective than the old program. O B. A mean reading rate of 94.7 wpm is not unusual since the probability of obtaining a result of 94.7 wpm or more is 0.1131. This means that we would expect a mean reading rate of 94.7 or higher from a population whose mean reading rate is 92 in 11 of every 100 random samples of size n= 20 students. The new program is not abundantly more effective than the old program. () There is a 5% chance that the mean reading speed of a random sample of 25 second grade students will exceed what value? There is a 5% chance that the mean reading speed of a random sample of 25 second grade students will exceed wpm. (Round to two decimal places as needed.)
The reading speed of second grade students in a large city is approximately normal, with a mean of 92 words per minute (wpm) and a standard deviation of 10 wpm. Complete parts (a) through (f). O A. If 100 independent samples of n= 28 students were chosen from this population, we would expect sample(s) to have a sample mean reading rate of exactly 97 words per minute. O B. If 100 independent samples of n= 28 students were chosen from this population, we would expect 0 sample(s) to have a sample mean reading rate of more than 97 words per minute. OC. If 100 independent samples of n= 28 students were chosen from this population, we would expect sample(s) to have a sample mean reading rate of less than 97 words per minute. (d) What effect does increasing the sample size have on the probability? Provide an explanation for this result. O A. Increasing the sample size decreases the probability because o; increases as n increases. B. Increasing the sample size decreases the probability because o; decreases as n increases. OC. Increasing the sample size increases the probability because o; decreases as n increases. O D. Increasing the sample size increases the probability because o; increases as n increases. (e) A teacher instituted a new reading program at school. After 10 weeks in the program, it was found that the mean reading speed of a random sample of 20 second grade students was 94.7 wpm. What might you conclude based on this result? Select the correct choice below and fill in the answer boxes within your choice. (Type integers or decimals rounded to four decimal places as needed.) O A. A mean reading rate of 94.7 wpm is unusual since the probability of obtaining a result of 94.7 wpm or more is . This means that we would expect a mean reading rate of 94.7 or higher from a population whose mean reading rate is 92 in of every 100 random samples of size n= 20 students. The new program is abundantly more effective than the old program. O B. A mean reading rate of 94.7 wpm is not unusual since the probability of obtaining a result of 94.7 wpm or more is 0.1131. This means that we would expect a mean reading rate of 94.7 or higher from a population whose mean reading rate is 92 in 11 of every 100 random samples of size n= 20 students. The new program is not abundantly more effective than the old program. () There is a 5% chance that the mean reading speed of a random sample of 25 second grade students will exceed what value? There is a 5% chance that the mean reading speed of a random sample of 25 second grade students will exceed wpm. (Round to two decimal places as needed.)

MATLAB: An Introduction with Applications
6th Edition
ISBN:9781119256830
Author:Amos Gilat
Publisher:Amos Gilat
Chapter1: Starting With Matlab
Section: Chapter Questions
Problem 1P

Related questions
Question
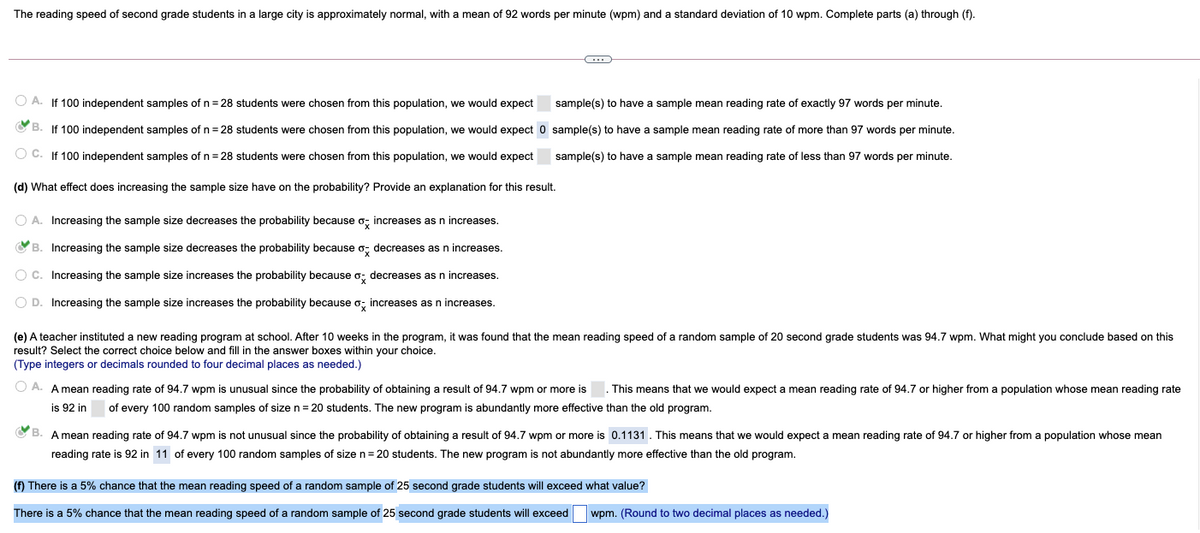
Transcribed Image Text:The reading speed of second grade students in a large city is approximately normal, with
mean of 92 words per minute (wpm) and a standard deviation of 10 wpm. Complete parts (a) through (f).
O A. If 100 independent samples of n = 28 students were chosen from this population, we would expect
sample(s) to have a sample mean reading rate of exactly 97 words per minute.
YB.
If 100 independent samples of n = 28 students were chosen from this population, we would expect 0 sample(s) to have a sample mean reading rate of more than 97 words per minute.
O C. If 100 independent samples of n = 28 students were chosen from this population, we would expect
sample(s) to have a sample mean reading rate of less than 97 words per minute.
(d) What effect does increasing the sample size have on the probability? Provide an explanation for this result.
A. Increasing the sample size decreases the probability because o; increases as n increases.
OB. Increasing the sample size decreases the probability because o; decreases as n increases.
O c. Increasing the sample size increases the probability because o; decreases as n increases.
O D. Increasing the sample size increases the probability because o; increases as n increases.
(e) A teacher instituted a new reading program at school. After 10 weeks in the program, it was found that the mean reading speed of a random sample of 20 second grade students was 94.7 wpm. What might you conclude based on this
result? Select the correct choice below and fill in the answer boxes within your choice.
(Type integers or decimals rounded to four decimal places as needed.)
O A. A mean reading rate of 94.7 wpm is unusual since the probability of obtaining a result of 94.7 wpm or more is
This means that we would expect a mean reading rate of 94.7 or higher from a population whose mean reading rate
is 92 in
of every 100 random samples of size n = 20 students. The new program is abundantly more effective than the old program.
O B. A mean reading rate of 94.7 wpm is not unusual since the probability of obtaining a result of 94.7 wpm or more is 0.1131. This means that we would expect a mean reading rate of 94.7 or higher from a population whose mean
reading rate is 92 in 11 of every 100 random samples of size n= 20 students. The new program is not abundantly more effective than the old program.
(f) There is a 5% chance that the mean reading speed of a random sample of 25 second grade students will exceed what value?
There is a 5% chance that the mean reading speed of a random sample of 25 second grade students will exceed
wpm. (Round to two decimal places as needed.)
Expert Solution
This question has been solved!
Explore an expertly crafted, step-by-step solution for a thorough understanding of key concepts.

This is a popular solution!

Trending now
This is a popular solution!

Step by step
Solved in 2 steps

Recommended textbooks for you
MATLAB: An Introduction with Applications
Statistics
ISBN:
9781119256830
Author:
Amos Gilat
Publisher:
John Wiley & Sons Inc

Probability and Statistics for Engineering and th…
Statistics
ISBN:
9781305251809
Author:
Jay L. Devore
Publisher:
Cengage Learning

Statistics for The Behavioral Sciences (MindTap C…
Statistics
ISBN:
9781305504912
Author:
Frederick J Gravetter, Larry B. Wallnau
Publisher:
Cengage Learning
MATLAB: An Introduction with Applications
Statistics
ISBN:
9781119256830
Author:
Amos Gilat
Publisher:
John Wiley & Sons Inc
Probability and Statistics for Engineering and th…
Statistics
ISBN:
9781305251809
Author:
Jay L. Devore
Publisher:
Cengage Learning
Statistics for The Behavioral Sciences (MindTap C…
Statistics
ISBN:
9781305504912
Author:
Frederick J Gravetter, Larry B. Wallnau
Publisher:
Cengage Learning

Elementary Statistics: Picturing the World (7th E…
Statistics
ISBN:
9780134683416
Author:
Ron Larson, Betsy Farber
Publisher:
PEARSON

The Basic Practice of Statistics
Statistics
ISBN:
9781319042578
Author:
David S. Moore, William I. Notz, Michael A. Fligner
Publisher:
W. H. Freeman

Introduction to the Practice of Statistics
Statistics
ISBN:
9781319013387
Author:
David S. Moore, George P. McCabe, Bruce A. Craig
Publisher:
W. H. Freeman