2. A study was made on the amount of converted sugar in a certain process at various temperatures. The data were coded and recorded as follows: 1.1 1.2 1.3 1.4 1.5 1.6 1.7 1.8 1.9 2.0 Temperature Conv. Sugar A. Which is the predictor variable and the response variable? B. Compute Pearson sample correlation coefficient r and interpret its nature and magnitude. C. Compute the sample coefficient of determination and interpret. 1.0 8.1 7.8 8.5 9.8 9.5 8.9 8.6 10.2 9.3 9.2 10.5
2. A study was made on the amount of converted sugar in a certain process at various temperatures. The data were coded and recorded as follows: 1.1 1.2 1.3 1.4 1.5 1.6 1.7 1.8 1.9 2.0 Temperature Conv. Sugar A. Which is the predictor variable and the response variable? B. Compute Pearson sample correlation coefficient r and interpret its nature and magnitude. C. Compute the sample coefficient of determination and interpret. 1.0 8.1 7.8 8.5 9.8 9.5 8.9 8.6 10.2 9.3 9.2 10.5

Glencoe Algebra 1, Student Edition, 9780079039897, 0079039898, 2018
18th Edition
ISBN:9780079039897
Author:Carter
Publisher:Carter
Chapter4: Equations Of Linear Functions
Section: Chapter Questions
Problem 8SGR

Related questions
Question
pls answer a,b,c
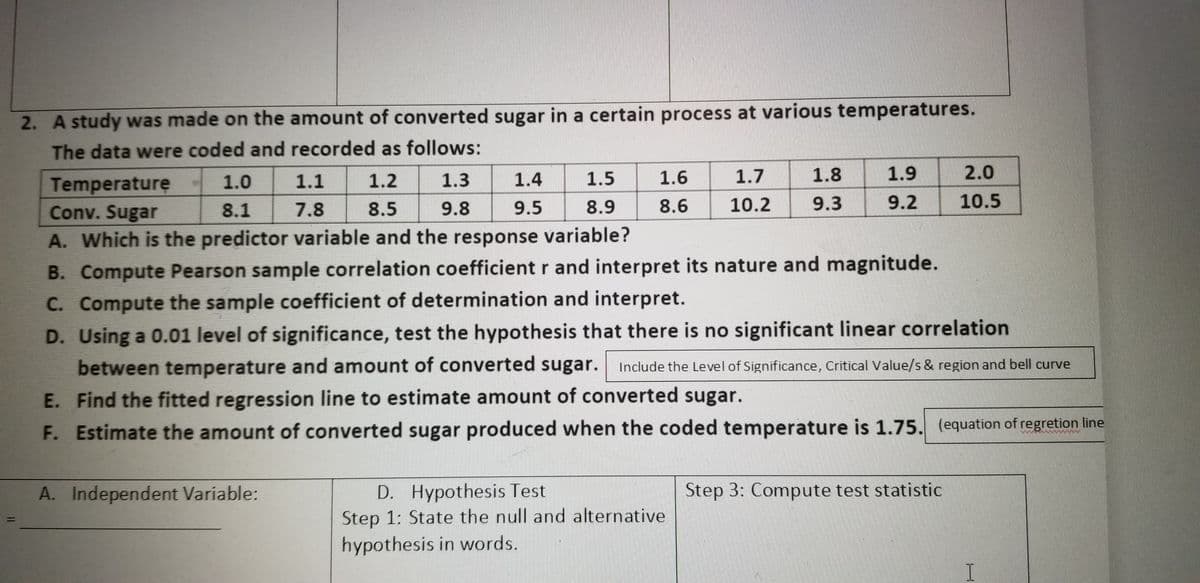
Transcribed Image Text:2. A study was made on the amount of converted sugar in a certain process at various temperatures.
The data were coded and recorded as follows:
1.3
1.4
1.5
1.6
1.7
1.8
1.9
2.0
Temperature
Conv. Sugar
1.0
1.1
1.2
8.1
7.8
8.5
9.8
9.5
8.9
8.6
10.2
9.3
9.2 10.5
A. Which is the predictor variable and the response variable?
B. Compute Pearson sample correlation coefficient r and interpret its nature and magnitude.
C. Compute the sample coefficient of determination and interpret.
D. Using a 0.01 level of significance, test the hypothesis that there is no significant linear correlation
between temperature and amount of converted sugar. Include the Level of Significance, Critical Value/s & region and bell curve
E. Find the fitted regression line to estimate amount of converted sugar.
F. Estimate the amount of converted sugar produced when the coded temperature is 1.75. (equation of regretion line
D. Hypothesis Test
Step 1: State the null and alternative
hypothesis in words.
A. Independent Variable:
Step 3: Compute test statistic
Expert Solution
This question has been solved!
Explore an expertly crafted, step-by-step solution for a thorough understanding of key concepts.

Step by step
Solved in 4 steps with 2 images

Recommended textbooks for you
Glencoe Algebra 1, Student Edition, 9780079039897…
Algebra
ISBN:
9780079039897
Author:
Carter
Publisher:
McGraw Hill
Glencoe Algebra 1, Student Edition, 9780079039897…
Algebra
ISBN:
9780079039897
Author:
Carter
Publisher:
McGraw Hill