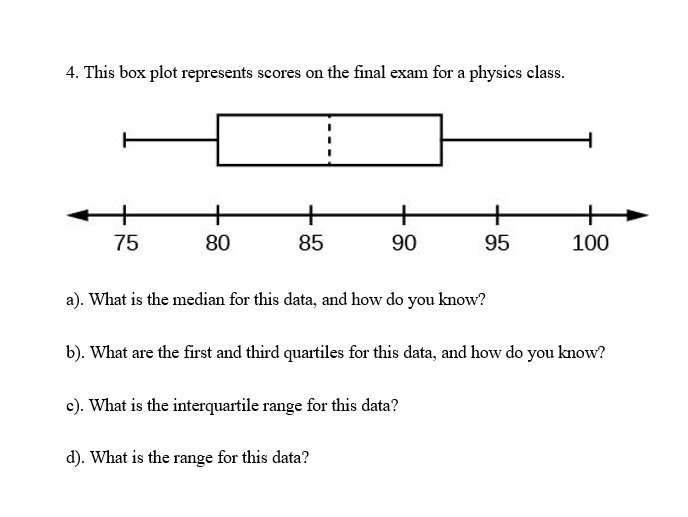
4. This box plot represents scores on the final exam for a physics class. + + 75 80 85 90 95 100 a). What is the median for this data, and how do you know? b). What are the first and third quartiles for this data, and how do you know? c). What is the interquartile range for this data? d). What is the range for this data?
4. This box plot represents scores on the final exam for a physics class. + + 75 80 85 90 95 100 a). What is the median for this data, and how do you know? b). What are the first and third quartiles for this data, and how do you know? c). What is the interquartile range for this data? d). What is the range for this data?

Glencoe Algebra 1, Student Edition, 9780079039897, 0079039898, 2018
18th Edition
ISBN:9780079039897
Author:Carter
Publisher:Carter
Chapter10: Statistics
Section10.3: Measures Of Spread
Problem 1GP

Related questions
Question
Practice Pack
Transcribed Image Text:4. This box plot represents scores on the final exam for a physics class.
+
+
75
80
85
90
95
100
a). What is the median for this data, and how do you know?
b). What are the first and third quartiles for this data, and how do you know?
c). What is the interquartile range for this data?
d). What is the range for this data?
Expert Solution
This question has been solved!
Explore an expertly crafted, step-by-step solution for a thorough understanding of key concepts.

This is a popular solution!

Includes step-by-step video

Trending now
This is a popular solution!

Learn your way
Includes step-by-step video

Step by step
Solved in 2 steps with 2 images

Recommended textbooks for you
Glencoe Algebra 1, Student Edition, 9780079039897…
Algebra
ISBN:
9780079039897
Author:
Carter
Publisher:
McGraw Hill
Glencoe Algebra 1, Student Edition, 9780079039897…
Algebra
ISBN:
9780079039897
Author:
Carter
Publisher:
McGraw Hill