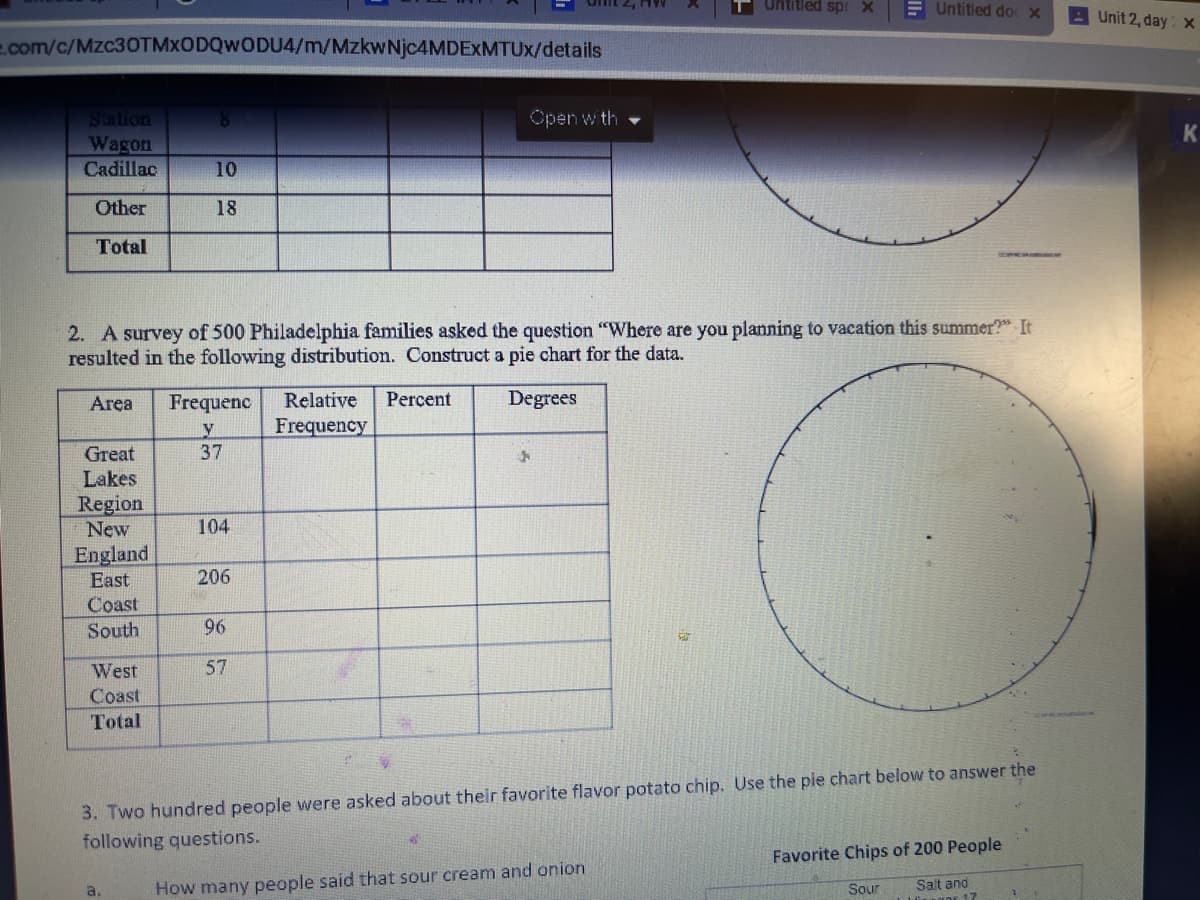
2. A survey of 500 Philadelphia families asked the question "Where are you planning to vacation this summer?" It resulted in the following distribution. Construct a pie chart for the data. Area Frequenc Relative Percent Degrees Frequency y 37 Great Lakes Region New 104 England East Coast South 206 96 West 57 Coast Total
Q: Calculate the median of the following distribution: CLASS FREQUENCY 10- 19 8 20-29 16 30-39 12 40-49…
A:
Q: 1. Make a questionnaire with one question (using Google form) for a sample size of 30 students to…
A: Since you have posted a question with multiple sub-parts, we will solve first three sub-parts for…
Q: What is the median of the distribution table below Delivery of Instruction Frequency Pure Online 20…
A: The table shows the frequencies of the delivery of instruction.
Q: A sample of students in a university café was asked the following questions. Identify the type of…
A: A sample of students in a university café was asked the following questions. a. What is your…
Q: Given the sample data: {1, 2, 3, 5, 7, 9, 12}, calculate the lower fourth. 2 2.5 О 3.0 O 2.0
A: We have given that, The sample data is, 1, 2, 3, 5, 7, 9, 12 Then, We will find the value of the…
Q: Determine whether or not this statement makes sense. Nielsen Media Research determined the…
A: Given statement is: Nielsen Media Research determined the precise proportion of all Americans…
Q: Given the sample data 21 19 13 32 27 find the range
A: Sample data: 21 ,19, 13 ,32, 27
Q: 14) Find the mean and median of the data in the following table: [ Tickets Frequency 14 12 14 21
A: Given: x f 4 14 5 7 6 12 7 14 8 21 Total 68
Q: A sample was taken of 25 Diploma students who were planning to further their study to degree level.…
A: The frequency distribution table is,
Q: If the distribution is approximately mound-shaped, what is the proportion less than 80.12 ? 15
A: Find the value of z using mean and standard deviation.
Q: The following table gives information on the amount (in dollars) Of the electric bills for a samle…
A: Sample Median: Generally, Median is exactly the middle of the data when the data is in ascending…
Q: In the data set below, 29 is an outlier: 19, 22, 24, 23, 29 , 22, 25 O True
A:
Q: A student was interested in the cigarette-smoking habits of college students and collected data from…
A: What type of chart best represents the relative class frequency ?
Q: 3.7 The article "Housework around the World" (USA Today, September 15, 2009) included the percentage…
A: (a) Enter the data into the excel sheet as follows: Select Insert> charts>All charts…
Q: a. What is the frequency for CEO ages berween 54 and 65? b. What percentage of CEOS are 65 vears or…
A: Consider the table , Age Frequency Relative frequency Cumulative relative frequency 40-44 3…
Q: Suppose automobile insurance companies gave annual premiums for top-rated companies in several…
A: Given boxplot:
Q: In a pie graph, if the blood type B represents 35% of the distribution, how many degrees would be…
A: Given information: It was stated that in a pie graph, blood type B represents 35%. Then need to find…
Q: The complete set of all possible observations or respondents are called? Choose the correct letter.…
A: Find the The complete set of all possible observations or respondents are called
Q: Consider the data set {5,2, 5, 3, 4}. What is the geometric mean for this set? Round your answer to…
A: Given query is to find geomagnetic mean of the data set.
Q: The following data give the results of a sample survey. The letters A, B and C represent the three…
A: Solution
Q: Elena asked 16 students how many hours they had spent doing homework during the previous week. The…
A: The size of the given data is n = 16 The minimum value in the data = 2 The maximum value in the data…
Q: Given the following distribution of scores: 2, 8, 2, 3, 6, 5, 7, 8, 4, 8, 2, 3 What is the median…
A:
Q: 2. Given a frequency distribution of a sample of college students in Marymount College was asked how…
A: The median is the middlemost data point in a dataset provided the dataset is arranged in an orderly…
Q: The next three questions concern the following scenario: To the right is a dotplot of the adult…
A: A distribution is said to be negatively skewed or skewed to the left if the data points are more…
Q: Given the data set: 1.7, 2.2, 3.9, 3.11 and 14.7; determine the sample mean and median respectively.…
A:
Q: Create a stem-and-leaf plot from the following data set listing the ages of 19 people attending a…
A: Left part of the digit is called stem and right part Is called leaf
Q: What is the mode for the following distribution of scores: Eye colour Frequency b) Blue…
A: The category having highest frequency is defined as mode. from the four distribution Brown Eye color…
Q: Shown below are the lengths in minutes of 6 randomly selected Disney movies. Use the data to compute…
A: It is given that the lengths of the 6 randomly selected Disney movies are: Bambi-69, Cinderalla=74,…
Q: Based on the given table below, what is the mode? Table 1. Distribution According to Favorite…
A: Given that,
Q: Find the median for the given sample data. A store manager kept track of the number of newspapers…
A: The median is the middle value in an ordered set of data Sort the data in ascending order. The…
Q: Find the range for the following sample data: 23 20 15 35 26
A:
Q: Find the population mean or sample mean as indicated. Population: 6, 9, 2, 12, 13, 24 A) x = 12 B) =…
A: We know, Sample mean is arithmetic mean of the sample data drawn from population. It is represented…
Q: 6. Take a look at the following sample data set: 40 4 8 63 61 240 60 65 70 90 66 165 Are there any…
A: Outliers: An outlier is a data point that differs significantly from other observations.…
Q: 1(a). What is the point estimate for the proportion of people who liked the chocolate bar?
A: here use given data
Q: Find average in classified data set (k=4) SIAflandırtmış-erilerde ortatameybulunuz (k-4) 17 21 23 24…
A: Average: In measures of central tendency, Average is nothing but Arithmetic Mean (A.M.). Arithmetic…
Q: 13. what is the median of the given data? * C. 7.5 D. 8 В. 7 A. 6
A: If there are even amount of number then for median we take pair of two middle term and divide by 2.…
Q: What is the mean of the distribution table below: Place of Residence Frequency Cavite 8 25 Batangas…
A: The objective is to find the mean of the given distribution table: Place of residence Frequency…
Q: Given this table, what is the median number of pets. Number Frequency of Pets 8 10 3 1 3.
A: It is an important part of statistics. It is widely used.
Q: A random sample of 1005 adult Americans was asked, “Who do you want to win the Super Bowl?” The…
A: Given: n = 1005 Los Angeles Rams 505 Cincinnati Bengals 375 Georgia Bulldogs 125
Q: A sample of Reese's pieces contains the following: 23 Orange, 14 Brown, 18 Yellow. What is the…
A:
Q: Suppose you surveyed 30 people and asked them whether they are white (W) or nonwhite (N) and how…
A: a. The variable race is classified into categories-whites (W) and non- whites (N). The numbers in…
Q: Find the midrange for the given sample data. 3) 49 52 52 52 74 67 55 55
A: The midrange of a set of observations is, (Maximum observation + Minimum observation)/2.
Q: Cosmic, Inc. is a software company. The ages of the employees are displayed in the histogram: 14…
A: Find the number of employees from the histogram
Q: Consider the boxplot below. 10 19 21 26 What quarter has the smallest spread of data? Third
A:
Q: Calculate the median and mode (by grouping method) from the following data: Central size : 15 25 35…
A:
Q: n alphabetical order, the six most common last names in the United States in 2018 are Brown, Garcia,…
A: Part 1: The given data can be summarized by relative and percent frequency distribution as,…
Q: Find the median for the given sample data. 2) A store manager kept track of the number of newspapers…
A:
Q: Hospitals In a study of births in New York State, data were collected from four hospitals coded as…
A: Given that,1 for Albany medical center1438 for Bellevue hospital center66 for Olean general…
Trending now
This is a popular solution!
Step by step
Solved in 2 steps with 1 images
- A random sample of customers was asked to select their favorite soft drink from a list of five brands. The results showed that 30 preferred Brand A, 50 preferred Brand B, 46 preferred Brand C, 100 preferred Brand D, and 14 preferred Brand E. a. Construct a pie chart. b. Construct a bar chart.Nationally, at least 60% of Ph.D. students have paid assistantships. A collegedean feels that this is not true in his state, so he randomly selects 50 Ph.D.students and finds that 26 have assistantships. At α = 0.05, is the deancorrect?An urn contains p black balls, q white balls, and r red balls; and n balls are chosen withoutreplacement.a) Find the joint pmf of the numbers of black, white, and red balls in the sample. b) Find the joint pmf of the number of black and white balls in the sample. c) Find the marginal pmf of the number of white balls in the sample.
- A research center claims that 30% of adults in a certain country would travel into space on a commercial flight if they could afford it. In a random sample of 1100 adults in that country, 34% say that they would travel into space on a commercial flight if they could afford it. At α=0.05, is there enough evidence to reject the research center's claim? Complete parts (a) through (d) below. (a) Identify the claim and state H0 and Ha. Identify the claim in this scenario. Select the correct choice below and fill in the answer box to complete your choice. (Type an integer or a decimal. Do not round.) A. At least enter your response here% of adults in the country would travel into space on a commercial flight if they could afford it. B. 3030% of adults in the country would travel into space on a commercial flight if they could afford it. C. The percentage adults in the country who would travel into space on a commercial flight if they could…A research center claims that 30% of adults in a certain country would travel into space on a commercial flight if they could afford it. In a random sample of 1100 adults in that country, 34% say that they would travel into space on a commercial flight if they could afford it. At α=0.05, is there enough evidence to reject the research center's claim? Complete parts (a) through (d) below. (a) Identify the claim and state H0 and Ha. Identify the claim in this scenario. Select the correct choice below and fill in the answer box to complete your choice. (Type an integer or a decimal. Do not round.) A. At least enter your response here% of adults in the country would travel into space on a commercial flight if they could afford it. B. enter your response here% of adults in the country would travel into space on a commercial flight if they could afford it. C. The percentage adults in the country who would travel into space on a commercial…The matchsticks in 10 packages of matches randomly selected from the matches produced by a match factory were counted and found as 39, 43, 35, 46, 47, 38, 41, 40, 45 and 36, respectively. Accordingly, what is the arithmetic average of the garbage in the packages produced by this match factory?
- A research center claims that 29% of adults in a certain country would travel into space on a commercial flight if they could afford it. In a random sample of 800 adults in that country, 31% say that they would travel into space on a commercial flight if they could afford it. At a=0.05, is there enough evidence to reject the research center's claim? Complete parts (a) through (d) below. (a) Identify the claim and state H0 and Ha. Identify the claim in this scenario. Select the correct choice below and fill in the answer box to complete your choice. (Type an integer or a decimal. Do not round.) A. The percentage of adults in the country who would travel into space on a commercial flight if they could afford it is not ______%. B. No more than ______% of adults in the country would travel into space on a commercial flight if they could afford it. C. ______% of adults in the country would travel into space on a commercial flight if they could afford it. D. At least ______% of…1. A storeowner wishes to see if people have a favorite day of the week to shop. Asample of 400 people is selected, and each is asked his her preference. The data areshown. At a = 0.05, test the claim that shoppers have no preference.Day Sun. Mon. Tue. Wed. Thurs. Fri. Sat.Number 28 16 20 26 74 96 1402. In a recent study, the following percentages of Lebanese retail TV sales based on sizewere reported: 27.2% small, 46.5% midsize, 8% large, and 18.3% luxury. A recentsurvey of retail TV shop in Beirut indicated that out of 100 TVs sold, 25 were small,50 were midsize, 10 were large, and 15 were luxury. At α = 0.05, is there sufficientevidence to conclude that the percentages differ from those stated in the report.3. A Nutritionist wishes to determine if there is a difference in the type of exercisesselected by male and female customers. A random sample of males and femalesprovides the following data. At α=0.05, can it be concluded that the type of exercisesselected is independent of the…In a sample of 20 kaing of mangoes, each containing 50 mangoes, the vendor found that 5, 8, 12, 3, 0, 6, 11, 7, 5, 4, 2, 9, 4, 2, 7, 9, 3, 6, 5, and 2 mangoes respectively are rotten. On the average, how many mangoes per kaing are rotten? Answer: How many percent of the total mangoes are rotten? Answer: Construct a pie graph showing the percentage of rotten versus not rotten mangoes in 20 kaings. Answer: If each mango can be sold at 20 pesos per piece, how much is the total price of the vendor for selling the mangoes that are not rotten? Answer:
- Molly's Reach, a regional restaurant and gift shop, Has recently launced an increased sales campaign, particularly focused on their gift shop. To determine if their proposal is of interest, they plan to survey a random sample of their regulat customers. Suppose that Molly Reach has an alphabetized list of regular cutomers who belong t rhie rewards progream. After randomly selecting a customer on the list, every 25th cutomer from that point on is chosen to be in the sampl. The sample is called: Simple Random Sampling Statified sampling Cluster Sampling Systematic Sampling Convenience Sampling2) In a sample of 50 car users, 15 are using Toyota, 20 are using BMW, 10 are using MB and the rest using Nissan. Construct a pie-chart for above information.Develop an OC curve for a sampling plan in whicha sample of n 10 items is drawn from lots of N 1000. Th eaccept/reject criteria are set up in such a way that we accept a lot ifno more than one defect (c 1) is found