2. a. If the shaded area on the left-hand tail of t- distribution with sample of size n = 28 is 0.01, what is the area to the left of t₁? b. What is the value of t₁? c. What does t₁ represents?
2. a. If the shaded area on the left-hand tail of t- distribution with sample of size n = 28 is 0.01, what is the area to the left of t₁? b. What is the value of t₁? c. What does t₁ represents?

Big Ideas Math A Bridge To Success Algebra 1: Student Edition 2015
1st Edition
ISBN:9781680331141
Author:HOUGHTON MIFFLIN HARCOURT
Publisher:HOUGHTON MIFFLIN HARCOURT
Chapter11: Data Analysis And Displays
Section: Chapter Questions
Problem 11CR

Related questions
Question
Please refer to the given lesson (sketch the normal curve also)
Transcribed Image Text:2. a. If the shaded area on the left-hand tail of t- distribution with sample of size n = 28 is 0.01, what is
the area to the left of t₁?
b. What is the value of t₁?
c. What does t₁ represents?
IV. Evaluation:
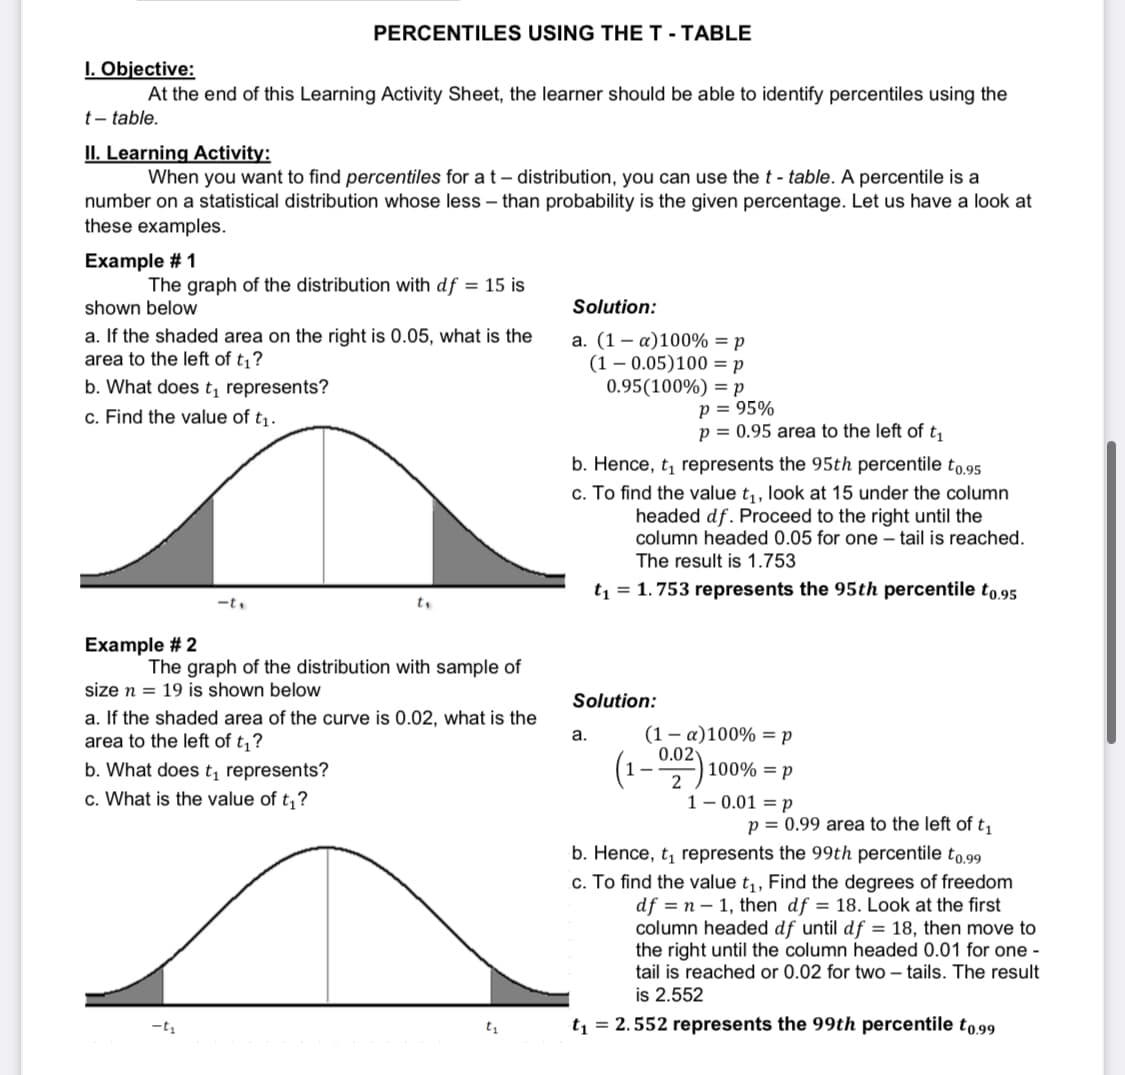
Transcribed Image Text:PERCENTILES USING THE T - TABLE
I. Objective:
At the end of this Learning Activity Sheet, the learner should be able to identify percentiles using the
t-table.
II. Learning Activity:
When you want to find percentiles for a t-distribution, you can use the t - table. A percentile is a
number on a statistical distribution whose less than probability is the given percentage. Let us have a look at
these examples.
Example # 1
The graph of the distribution with df = 15 is
shown below
Solution:
a. If the shaded area on the right is 0.05, what is the
area to the left of t₁?
a. (1 a)100% = p
(10.05)100 = p
b. What does t₁ represents?
0.95(100%) p
c. Find the value of t₁.
P = 95%
p = 0.95 area to the left of t₁
b. Hence, t₁ represents the 95th percentile to.95
c. To find the value t₁, look at 15 under the column
headed df. Proceed to the right until the
column headed 0.05 for one - tail is reached.
The result is 1.753
t₁ = 1.753 represents the 95th percentile to.95
-t₁
t₁
Example # 2
The graph of the distribution with sample of
size n 19 is shown below
Solution:
a. If the shaded area of the curve is 0.02, what is the
area to the left of t₁?
a.
(1 a)100% = p
0.02
b. What does t₁ represents?
100% P
2
c. What is the value of t₁?
1-0.01 = p
p = 0.99 area to the left of t₁
b. Hence, t₁ represents the 99th percentile to.99
c. To find the value t₁, Find the degrees of freedom
df = n1, then df = 18. Look at the first
column headed df until df = 18, then move to
the right until the column headed 0.01 for one -
tail is reached or 0.02 for two-tails. The result
is 2.552
t₁ = 2.552 represents the 99th percentile t0.99
5
t₁
Expert Solution
This question has been solved!
Explore an expertly crafted, step-by-step solution for a thorough understanding of key concepts.

Step by step
Solved in 4 steps with 1 images

Recommended textbooks for you
Big Ideas Math A Bridge To Success Algebra 1: Stu…
Algebra
ISBN:
9781680331141
Author:
HOUGHTON MIFFLIN HARCOURT
Publisher:
Houghton Mifflin Harcourt

Glencoe Algebra 1, Student Edition, 9780079039897…
Algebra
ISBN:
9780079039897
Author:
Carter
Publisher:
McGraw Hill
Big Ideas Math A Bridge To Success Algebra 1: Stu…
Algebra
ISBN:
9781680331141
Author:
HOUGHTON MIFFLIN HARCOURT
Publisher:
Houghton Mifflin Harcourt
Glencoe Algebra 1, Student Edition, 9780079039897…
Algebra
ISBN:
9780079039897
Author:
Carter
Publisher:
McGraw Hill