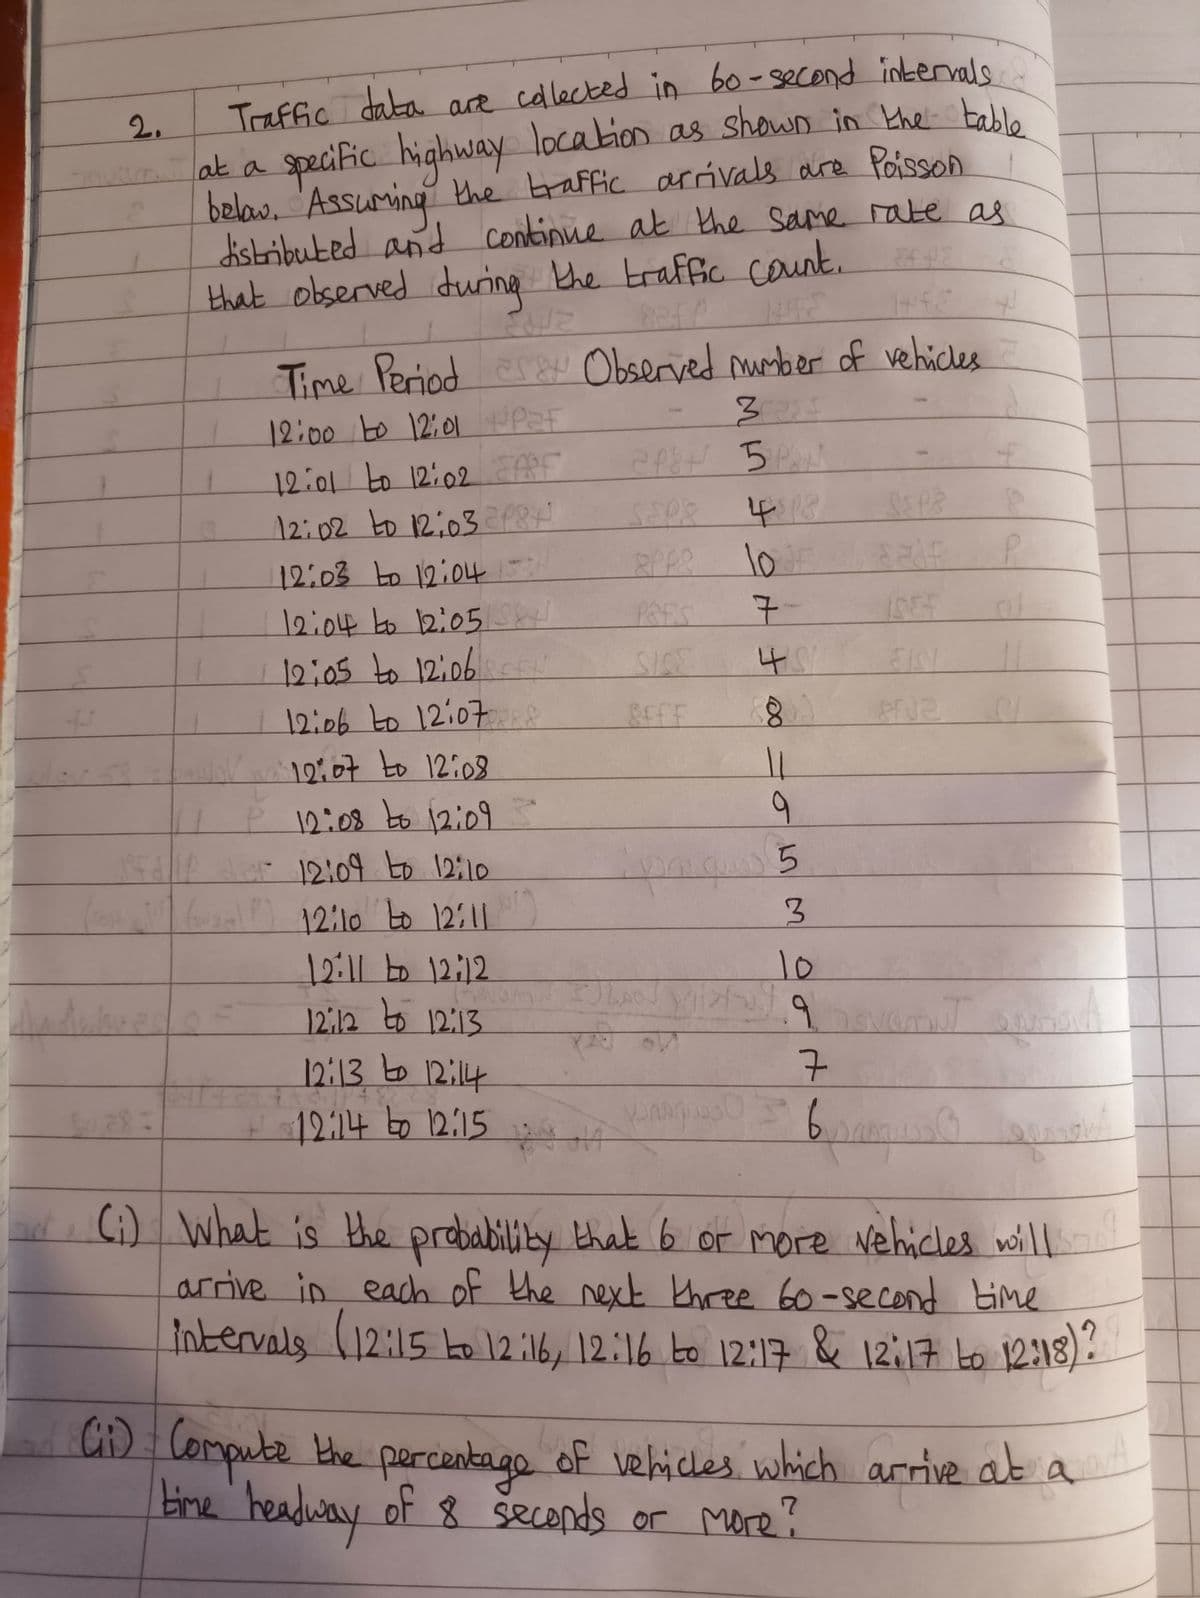
+ 2. at a Traffic data are collected in 60-second intervals specific highway location as shown in the table below. Assuring the traffic arrivals are Poisson distributed and continue at the same rate as that observed during the traffic count. 442 Time Period as Observed number of vehicles I 12:00 to 12:01 +PZE 324 12:01 to 12:02 EAF 218+ 5 PAN F 13 12:02 to 12:03 21841 SEPR 4518 SSPB L 12:03 to 12:04 - &PP8 P 12:04 to 12:05 SH PRES 7 ISEF 01 12:05 to 12:06 SISE 48 ELSI 12:06 to 12:07 8 &FFF FJ2 12:07 to 12:08 11 12:08 to 12:09 9 SP AF 12:04 to 12:10 pay 5 (12:10 to 12:11 3 12:11 to 12:12 10 12:12 to 12:13 रचे बाल 12:13 to 12:14 7 12:14 to 12:15 14 (i) What is the probability that 6 or more vehicles wills arrive in each of the next three 60-second time intervals (12:15 to 12:16, 12:16 to 12:17 & 12:17 to 12:18)? - (ii) Compute the percentage of vehicles which arrive at time headway of 8 seconds or more? a
+ 2. at a Traffic data are collected in 60-second intervals specific highway location as shown in the table below. Assuring the traffic arrivals are Poisson distributed and continue at the same rate as that observed during the traffic count. 442 Time Period as Observed number of vehicles I 12:00 to 12:01 +PZE 324 12:01 to 12:02 EAF 218+ 5 PAN F 13 12:02 to 12:03 21841 SEPR 4518 SSPB L 12:03 to 12:04 - &PP8 P 12:04 to 12:05 SH PRES 7 ISEF 01 12:05 to 12:06 SISE 48 ELSI 12:06 to 12:07 8 &FFF FJ2 12:07 to 12:08 11 12:08 to 12:09 9 SP AF 12:04 to 12:10 pay 5 (12:10 to 12:11 3 12:11 to 12:12 10 12:12 to 12:13 रचे बाल 12:13 to 12:14 7 12:14 to 12:15 14 (i) What is the probability that 6 or more vehicles wills arrive in each of the next three 60-second time intervals (12:15 to 12:16, 12:16 to 12:17 & 12:17 to 12:18)? - (ii) Compute the percentage of vehicles which arrive at time headway of 8 seconds or more? a

Traffic and Highway Engineering
5th Edition
ISBN:9781305156241
Author:Garber, Nicholas J.
Publisher:Garber, Nicholas J.
Chapter12: Forecasting Travel Demand
Section: Chapter Questions
Problem 25P

Related questions
Question
100%
Hello, can I get help in answering this question please?
Transcribed Image Text:+
2.
at a
Traffic data are collected in 60-second intervals
specific highway location as shown in the table
below. Assuring the traffic arrivals are Poisson
distributed and continue at the same rate as
that observed during the traffic count. 442
Time Period as Observed number of vehicles
I
12:00 to 12:01 +PZE
324
12:01 to 12:02 EAF
218+ 5 PAN
F
13
12:02 to 12:03 21841
SEPR
4518
SSPB
L
12:03 to 12:04 -
&PP8
P
12:04 to 12:05 SH
PRES
7
ISEF
01
12:05 to 12:06
SISE
48
ELSI
12:06 to 12:07 8
&FFF
FJ2
12:07 to 12:08
11
12:08 to 12:09
9
SP AF 12:04 to 12:10
pay 5
(12:10 to 12:11
3
12:11 to 12:12
10
12:12 to 12:13
रचे बाल
12:13 to 12:14
7
12:14 to 12:15 14
(i) What is the probability that 6 or more vehicles wills
arrive in each of the next three 60-second time
intervals (12:15 to 12:16, 12:16 to 12:17 & 12:17 to 12:18)?
-
(ii) Compute the percentage of vehicles which arrive at
time headway of 8 seconds or more?
a
Expert Solution
This question has been solved!
Explore an expertly crafted, step-by-step solution for a thorough understanding of key concepts.

Step by step
Solved in 1 steps

Recommended textbooks for you
Traffic and Highway Engineering
Civil Engineering
ISBN:
9781305156241
Author:
Garber, Nicholas J.
Publisher:
Cengage Learning
Traffic and Highway Engineering
Civil Engineering
ISBN:
9781305156241
Author:
Garber, Nicholas J.
Publisher:
Cengage Learning