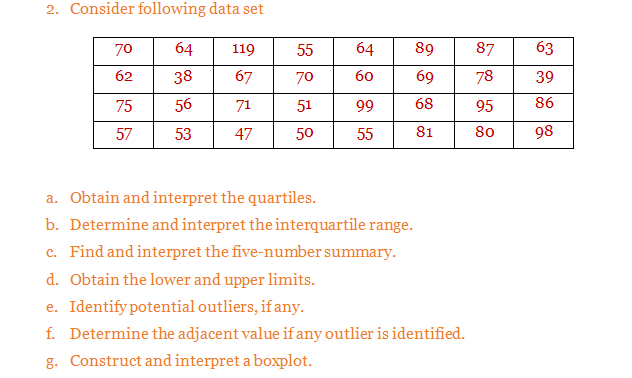
2. Consider following data set 70 64 119 55 64 89 87 63 62 38 67 70 60 69 78 39 75 56 71 51 99 68 95 86 57 53 47 50 55 81 80 98 a. Obtain and interpret the quartiles. b. Determine and interpret the interquartile range. c. Find and interpret the five-number summary. d. Obtain the lower and upper limits. e. Identify potential outliers, if any. f. Determine the adjacent value if any outlier is identified. g. Construct and interpret a boxplot.
Q: Use the accompanying data set to complete the following actions. a. Find the quartiles. b. Find the…
A:
Q: a. Find the lower quartile. b. Find the median. c. Find the upper quartile.
A: Since you have posted a question with multiple sub-parts, we will solve first three subparts for…
Q: Use the accompanying data set to complete the following actions. a. Find the quartiles. b. Find the…
A: Position X (Asc. Order) 1 15 2 29 3 30 4 34 5 36 6 37 7 38 8 38 9 39 10 39 11…
Q: 4. Consider the below data set: 65 87 x 75| 80 93 82 78 | 86 68 84 77 72 89 71 98 y 72 91 80 95 74…
A: Given: The data set: - x y 75 82 80 78 93 86 65 72 87 91 71 80 98 95 68 72 84…
Q: Given the following data: 260 380 360 320 325 350 340 370 340 520 340 325 350 250 280 300 340 360…
A: The values of five number summary are : {Min, Q1, Median, Q3, Max} = {250, 300, 340, 357.5, 520}
Q: Use this data set to answer the following questions 115 191 153 194 236 184 216 185 183 202 a.…
A: The sorted data set is 115,153,183,184,185,191,194,202,216,236. a.)The five number summary consists…
Q: Use the accompanying data set to complete the following actions. a. Find the quartiles. b. Find the…
A: Given data: 41, 52, 37, 45, 40, 37, 39, 47, 45, 37, 35, 56, 43, 34, 15, 53, 39, 51, 30, 30. The…
Q: Given the following data for 25 male students, build a modified box plot and identify the required…
A: Hey there.! Thank you for posting your question, since you've posted multiple questions and as per…
Q: 3. Consider the following data points: 29 32 34 38 38 41 52 60 8. 96 Identify any outliers in the…
A: Here's the explanation for this. Take note that , Any number greater than Q3 + 1.5 x IQR , is a…
Q: Use the accompanying data set to complete the following actions. a. Find the quartiles. b. Find the…
A: Given:
Q: Use the accompanying data set to complete the following actions. a. Find the quartiles. b. Find the…
A: Answer :- a. Given that N=15 Arrange the values in ascending order…
Q: 4. Consider the below data set: x 75 80 93 y 82 78 86 65 87 71 98 68 84 77 72 91 80 95 72 89 | 74…
A:
Q: Use the accompanying data set to complete the following actions. a. Find the quartiles. b. Find the…
A:
Q: The following data are the number of pages in 40 books on a shelf. 132; 140; 178; 190; 205; 215;…
A: Given,sample size(n)=40given data is already arranged in ascending order.
Q: Answer the following questions for the following heights (in centimeters) of children in one Class.…
A: Hi! Thank you for the question, As per the honor code, we are allowed to answer three sub-parts at a…
Q: Using the Teice rule de Il the data set 12.7 14.2 15.4 19.8 17.5 2.3 14.2 11.8 12.3 29.8 has any…
A: We have given that the data of sample size n is 10.
Q: 2. Consider following data set 70 64 119 55 64 89 87 63 62 38 67 70 60 69 78 39 75 56 71 51 66 68 95…
A: Hey, since there are multiple subparts posted, we will answer first three subparts. If you want any…
Q: Use the accompanying data set to complete the following actions. 1. Find the quartiles. . Find the…
A:
Q: Use the accompanying data set to complete the following actions. a. Find the quartiles. b. Find the…
A: Given data, 42,50,36,44,42,37,41,46,45,38,34,54,43,34,15,51,39,51,29,29 Sort given data in…
Q: For the data set below, find the outlier(s). 150 159 159 166 181 164 164 141 169 189 169 O 189 O 141…
A: Given data is150 , 159, 159, 166, 181, 164, 164, 141, 169, 189, 169sample size(n)=11Arrange the…
Q: a) Find the 48th and 70th percentile of the following set of data. b) Check the following data for…
A: Percentile: A percentile is a comparison score between a specified score and the scores of the…
Q: Calculate the co-efficient of concurrent deviation from the following data : X: 360 364 372 382 366…
A:
Q: Use the accompanying data set to complete the following actions. a. Find the quartiles. b. Find the…
A: Use EXCEL Procedure to obtain the value of first quartile. Follow the instruction to obtain the…
Q: Use the accompanying data set to complete the following actions. a. Find the quartiles. b. Find the…
A: Data 61, 55,62,59,64,63,62,57,62,64,61,59,59,56,72
Q: The following data represent salaries, in thousands of dollars, for employees of a small company.…
A: A five-number summary consists of five values: the most extreme values in the data set (i.e. the…
Q: Use the accompanying data set to complete the following actions. a. Find the quartiles. b. Find the…
A: Formula : IQR = Q3-Q1
Q: Use the accompanying data set to complete the following actions. a. Find the quartiles. b. Find the…
A: Firstly Arrange the data in Ascending Order- 54 56 57 59 59 59 59 61 61 62 63 63 64 64…
Q: Calculate the value of r with the Concurrent deviation method for the following data. X: 15 14 21 14…
A: The following data is given: x Y 15 31 14 46 21 31 14 42 18 40 32 36 19 30 18 29…
Q: Calculate the coefficient of concurrent deviations from the data given below: Year 1993 1994 1995…
A: Price sign a=sign( deviation from previous value) Demand sign b=sign(deviation from previous value)…
Q: The following data represents the GPA of a sample of 15 students enrolled in a history class.…
A: The following data represents the GPA of a sample of 15 students enrolled in a history class. 3.4,…
Q: 21 For the data set *37 82 20 25 31 10 41 44 4 36 68 a Find the first and third quartiles. b Find…
A: Given observations Data 37 82 20 25 31 10 41 44 4 36 68
Q: Consider the following set of data. 11, 19, 19, 20, 25, 25, 38 To be an outlier, an observation must…
A: Given data: 11, 19, 19, 20, 25, 25, 38. Data values not following expected patterns are called…
Q: The ages of the 36 millionaires sampled are arranged in increasing order in the following table (can…
A: The data is already arranged in increasing order so we don't to arrange it again. Now calculate the…
Q: Use the accompanying data set to complete the following actions. a. Find the quartiles. b. Find the…
A: According to the given information, we have Data set: 57, 60, 57, 64, 62, 64, 58, 64, 64, 59, 54,…
Q: For the following data a) Make a frequency distribution table with relative frequency. b) Construct…
A: When large data is available on discrete or continuous variable, it becomes necessary to condense…
Q: Use the accompanying data set to complete the following actions. a. Find the quartiles. b. Find the…
A:
Q: Use the accompanying data set to complete the following actions. a. Find the quartiles. b. Find the…
A: Given data is65,57,60,59,55,55,62,65,55,56,54,64,64,65,85Arrange the data in ascending…
Q: Use the accompanying data set to complete the following actions. a. Find the quartiles. b. Find the…
A:
Q: 4. Consider the below data set: X 75 80 93 65 87 71 98 68 84 77 y 82 78 86 72 91 80 95 72 89 74 (a)…
A: Hi! Thank you for the question as per the honour code, we’ll answer the first question since the…
Q: 21) For the data set below, find the outlier(s). 186 153 154 161 160 157 145 176 133 154 157 B) 133,…
A: Given data, 186,153,154,161,160,157,145,176,133,154,157
Q: Use the accompanying data set to complete the following actions. a. Find the quartiles. b. Find the…
A: We want to find Quartiles , IQR and outlier
Q: 1. Construct a stem and leaf plot for these 50 measurements 3.1 49 28 36 25 45 35 37 41 29 38 62 25…
A: Since you have asked multiple question, we will solve the first question for you. If you want any…
Q: For the given data set: [5.1, 7.3, 7.5, 7.2, 7.4, and 7.1] Determine the outlier using Grubbs test.…
A: The given values are: x : 5.1, 7.3, 7.5, 7.2, 7.4, 7.1
Q: The following is data from the timeš their breath, in seconds: 85 42 90 25 77 51 58 35 105 46 44 45…
A: Hi! Thank you for the question, As per the honor code, we are allowed to answer one question at a…
Q: Construct a frequency distribution and determine the following. a. Range e. Relative Frequencies b.…
A: Data is given, We have to construct frequency distribution We have to calculate, range, interval...…
Q: 5 20 22 27 30 17 12 15 16 9 18 13 12 28 19 3. Compute the five-number summary and the interquartile…
A: Given data is5,20,22,27,30,17,12,15,16,9,18,13,12,28,19Arrange the data in Ascending…
Q: Given the following data: 1.45 1.57 1.64 1.77 1.69 1.80 1.86 1.89 1.59 1.94 1.98 y 60 58 75 70 77 82…
A: Correlation: Correlation is a measure that indicates the “go-togetherness” of two data sets. It can…
Q: Use this data set to answer the following questions. (CSLO 1,2,7) 115 184 191 216 153 185 194 183…
A: Given data: 115, 191, 153, 194, 236, 184, 216, 185, 183, 202 Interquartile range is a measure of…
Q: Calculate the coefficient of concurrent deviations from the data given below 1988 Year 1985 1986…
A:
Permutations and Combinations
If there are 5 dishes, they can be relished in any order at a time. In permutation, it should be in a particular order. In combination, the order does not matter. Take 3 letters a, b, and c. The possible ways of pairing any two letters are ab, bc, ac, ba, cb and ca. It is in a particular order. So, this can be called the permutation of a, b, and c. But if the order does not matter then ab is the same as ba. Similarly, bc is the same as cb and ac is the same as ca. Here the list has ab, bc, and ac alone. This can be called the combination of a, b, and c.
Counting Theory
The fundamental counting principle is a rule that is used to count the total number of possible outcomes in a given situation.
NEED PART G ANSWER ONLY
Trending now
This is a popular solution!
Step by step
Solved in 2 steps with 2 images
- Given the following data for 25 male students, build a modified box plot and identify the required statistics. Weight (lb): 123 134 140 148 149 150 150 150 155 158 160 160 163 170 170 175 175 175 180 185 190 195 223 231 -Identify the median for this data -identify the interquartile range -identify the value of the upper limit -identify the value of the adjacent Ppoint -is the minimum the adjacent point?The National Association of Home Builders provided data on the cost of the most popularhome remodeling projects. Sample data on cost in thousands of dollars for two types of remodelingprojects are as follows. Kitchen Master Bedroom Kitchen Master Bedroom25.2 18.0 23.0 17.817.4 22.9 19.7 24.622.8 26.4 16.9 21.021.9 24.8 21.819.7 26.9 23.6 a. Develop a point estimate of the difference between the population mean remodelingcosts for the two types of projects.b. Develop a 90% confidence interval for the difference between the two population means.Define the following statistical terms: Range: Outlier: Variable:
- An agent for a residential real estate company in a large city has the business objective of developing more accurate estimates of the monthly rental cost for apartments. Toward that goal, the agent would like to use the size of an apartment, as defined by square footage to predict the monthly rental cost. The agent selects a sample of 25 apartments in a particular residential neighborhood and collects the following data: Size (square feet) Rent ($) 850 1950 1450 2600 1085 2200 1232 2500 718 1950 1485 2700 1136 2650 726 1935 700 1875 956 2150 1100 2400 1285 2650 1985 3300 1369 2800 1175 2400 1225 2450 1245 2100 1259 2700 1150 2200 896 2150 1361 2600 1040 2650 755 2200 1000 1800 1200 2750 Make a Normal Probability Plot and a Residual plot of the Residuals (Y axis) vs. Apartment Size (X axis). Based on these results,…An agent for a residential real estate company in a large city has the business objective of developing more accurate estimates of the monthly rental cost for apartments. Toward that goal, the agent would like to use the size of an apartment, as defined by square footage to predict the monthly rental cost. The agent selects a sample of 25 apartments in a particular residential neighborhood and collects the following data: Size (square feet) Rent ($) 850 1950 1450 2600 1085 2200 1232 2500 718 1950 1485 2700 1136 2650 726 1935 700 1875 956 2150 1100 2400 1285 2650 1985 3300 1369 2800 1175 2400 1225 2450 1245 2100 1259 2700 1150 2200 896 2150 1361 2600 1040 2650 755 2200 1000 1800 1200 2750 (a) Construct a scatter plot. (b) Use the least-squares method to determine the regression coefficients (intercept and slope). (c)…An agent for a residential real estate company in a large city has the business objective of developing more accurate estimates of the monthly rental cost for apartments. Toward that goal, the agent would like to use the size of an apartment, as defined by square footage to predict the monthly rental cost. The agent selects a sample of 25 apartments in a particular residential neighborhood and collects the following data: Size (square feet) Rent ($) 850 1950 1450 2600 1085 2200 1232 2500 718 1950 1485 2700 1136 2650 726 1935 700 1875 956 2150 1100 2400 1285 2650 1985 3300 1369 2800 1175 2400 1225 2450 1245 2100 1259 2700 1150 2200 896 2150 1361 2600 1040 2650 755 2200 1000 1800 1200 2750 For these data, Syx = 194.5953946 and hi = 0.049156908 when X = 1000. *Round final answers below to three decimal places. Do not…
- An agent for a residential real estate company in a large city has the business objective of developing more accurate estimates of the monthly rental cost for apartments. Toward that goal, the agent would like to use the size of an apartment, as defined by square footage to predict the monthly rental cost. The agent selects a sample of 25 apartments in a particular residential neighborhood and collects the following data: Size (square feet) Rent ($) 850 1950 1450 2600 1085 2200 1232 2500 718 1950 1485 2700 1136 2650 726 1935 700 1875 956 2150 1100 2400 1285 2650 1985 3300 1369 2800 1175 2400 1225 2450 1245 2100 1259 2700 1150 2200 896 2150 1361 2600 1040 2650 755 2200 1000 1800 1200 2750 (a) Determine the coefficient of determination, r2, and interpret its meaning. (b) Determine the standard error of the estimate (Syx).…A certain association provided data on the cost of the most popular home remodeling projects. Sample data on the cost in thousands of dollars for two types of remodeling projects are as follows. Kitchen MasterBedroom 26.2 19.0 19.4 23.9 23.8 27.4 23.9 25.8 21.7 27.9 25.0 18.8 20.7 25.6 17.9 22.0 22.8 24.6 (a) Develop a point estimate of the difference (in thousands of dollars) between the population mean remodeling costs for the two types of projects. (b) Develop a 90% confidence interval for the difference (in thousands of dollars) between the two population means.The National Association of Home Builders provided data on the cost of the most popular home remodeling projects. Sample data on cost in thousands of dollars for two types of remodeling projects are as follows. Kitchen Master Bedroom 25.2 18.0 17.4 22.9 22.8 26.4 21.9 24.8 19.7 26.9 23.0 17.8 19.7 24.6 16.9 21.0 21.8 23.6 Develop a point estimate of the difference between the population mean remodeling costs for the two types of projects. Develop a 90% confidence interval for the difference between the two population means.
- Is the number of square feet of living space a good predictor of a house’s selling price? The following data collected in April, 2015, show the square footage and selling price for fifteen houses in Winston Salem, North Carolina. Size (1000s sq. ft) Selling Price ($1000s) 1.26 117.5 3.02 299.9 1.99 139.0 0.91 45.6 1.87 129.9 2.63 274.9 2.60 259.9 2.27 177.0 2.30 175.0 2.08 189.9 1.12 95.0 1.38 82.1 1.80 169.0 1.57 96.5 1.45 114.9 Develop a scatter diagram with square feet of living space as the independent variable and selling price as the dependent variable. What does the scatter diagram indicate about the relationship between the size of a house and the selling price? a. Develop the estimated regression equation that could be used to predict the selling price given the number of square feet of living space. Please do not hand write. thank you.For the Facebook data provided, find the range, variance, standard deviation, and interquartile range for hours online/week and number of friends in the sample using the appropriate Excel function. Compare these measures of location. Student Gender Hours online/week Friends 1 female 12 110 2 female 4 150 3 male 8 430 4 female 5 60 5 female 2 30 6 female 4 50 7 male 4 120 8 female 2 50 9 male 6…answer the following questions regarding interquartile range and outliers calculate the irq use the iqr to identify any outliers the following data gives the amount of student loans in thousands of dollars held by a group of 20 randomly selected recent college graduates 0 9.9 25.5 50.5 0 10.8 29.3 65.2 6.7 17.0 30.0 85.2 7.6 20.5 34.8 95.8 8.1 24.6 44.5 102.5