Given the following data: 1.45 1.57 1.64 1.77 1.69 1.80 1.86 1.89 1.59 1.94 1.98 y 60 58 75 70 77 82 67. 95 85 81 76 (e) Describe what these statistics tell you about the relationship between the X and Y variables. (f) Are there any outliers? Briefly explain.
Given the following data: 1.45 1.57 1.64 1.77 1.69 1.80 1.86 1.89 1.59 1.94 1.98 y 60 58 75 70 77 82 67. 95 85 81 76 (e) Describe what these statistics tell you about the relationship between the X and Y variables. (f) Are there any outliers? Briefly explain.

Glencoe Algebra 1, Student Edition, 9780079039897, 0079039898, 2018
18th Edition
ISBN:9780079039897
Author:Carter
Publisher:Carter
Chapter4: Equations Of Linear Functions
Section4.5: Correlation And Causation
Problem 23PFA

Related questions
Question
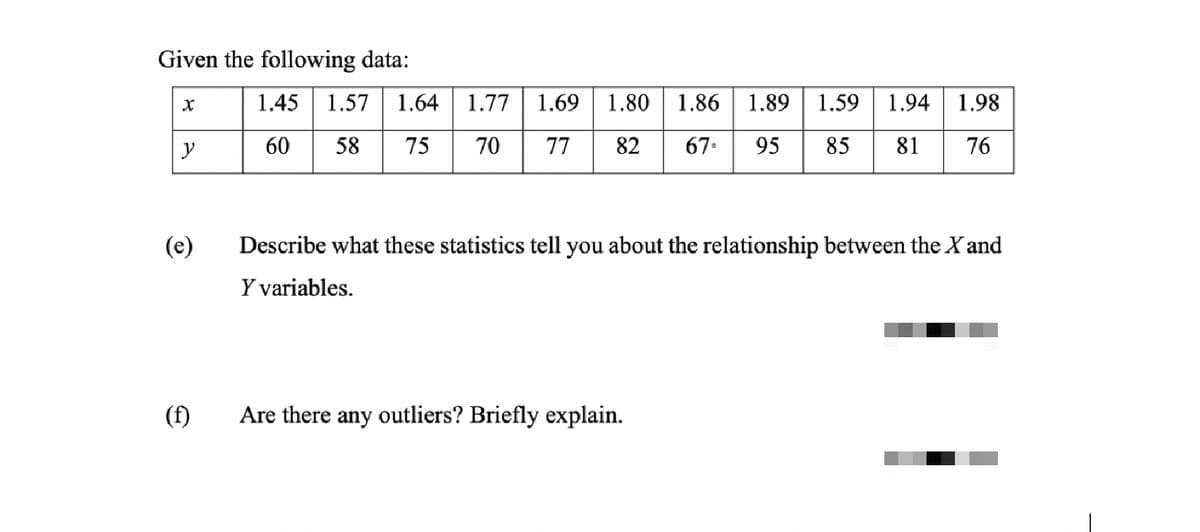
Transcribed Image Text:Given the following data:
1.45
1.57
1.64
1.77
1.69
1.80
1.86
1.89
1.59
1.94
1.98
y
60
58
75
70
77
82
67.
95
85
81
76
(e)
Describe what these statistics tell you about the relationship between the Xand
Y variables.
(f)
Are there any outliers? Briefly explain.
Expert Solution
This question has been solved!
Explore an expertly crafted, step-by-step solution for a thorough understanding of key concepts.

Step by step
Solved in 2 steps with 1 images

Recommended textbooks for you
Glencoe Algebra 1, Student Edition, 9780079039897…
Algebra
ISBN:
9780079039897
Author:
Carter
Publisher:
McGraw Hill
Glencoe Algebra 1, Student Edition, 9780079039897…
Algebra
ISBN:
9780079039897
Author:
Carter
Publisher:
McGraw Hill