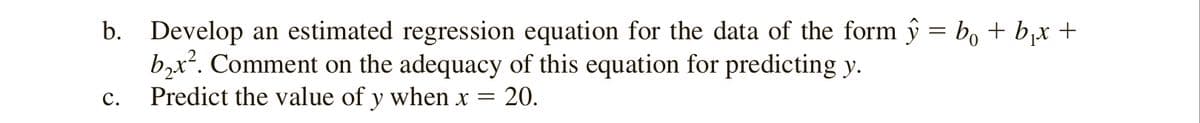
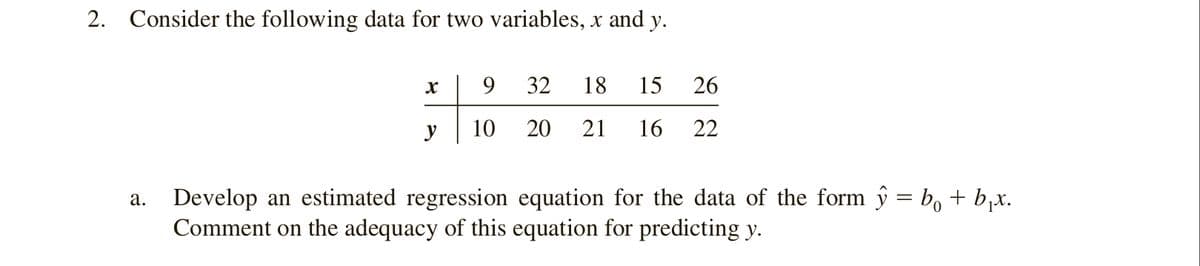
2. Consider the following data for two variables, x and y. 32 18 15 26 у 10 20 21 16 22 a. Develop an estimated regression equation for the data of the form ŷ = b, + b,x. Comment on the adequacy of this equation for predicting y.


Q: The table below shows the number of state-registered automatic weapons and the murder rate for…
A:
Q: Given the following data pairs (x, y), find the regression equation. y2 ху 6. 4 36 12 4. 16 8. 25 15…
A: Given Data: ∑x=10 ∑y=16∑x2=30 ∑y2=74∑xy=38 n=4
Q: Obtain the equations of the lines of regression of Y on X from the following data. X : 12 18 24 30…
A: Introduction: Consider that x is the independent variable and y is the dependent variable. The size…
Q: houschold a and their monlhly expenditure y. A sample from the study is shown below. 1 3000 2 4000 3…
A: In this case, monthly expenditure is dependent variable y and number of family members in the…
Q: e five observations for two variables, and y. 3 5 13 18 20 54 56 49 24 13 mated regression equation…
A:
Q: The table below shows the nurmber of state-registered automatic weapons and the murder rate for…
A:
Q: Consider the following data for two variables, x and y. X 9 32 18 15 26 Y 9 19 22 17 22 (a)…
A: (a) Develop an estimated regression equation for the data of the form: ŷ = b0 + b1x: The least…
Q: Given are five observations for two variables, x and y. x;| 3 12 6 20 14 yi | 55 40 55 10 15 a.…
A:
Q: Given are five observations collected in a regression study on two variables. xi 2 6 9 13 20 yi 7 18…
A: The provided data in the question is: x y 2 7 6 18 9 9 13 26 20 23 To find the…
Q: Consider the following data for two variables, x and y. 9 32 18 15 26 y 10 19 20 17 21 (a) Develop…
A: Solution : Given : α = 0.05, n= 5 X 9 32 18 15 26 Y 10 19 20 17 21 a) Estimated regression…
Q: Given are five observations for two variables, and . xi 1 3 12 15 17 yi 54 51 43 25 12 The…
A: Note: Please repost 2nd question as i can answer only 3 subparts as per my policy. X Y X*Y X*X…
Q: Consider the following data for two variables, x and y. 32 18 15 9 26 y 10 21 | 22 17| 23 (a)…
A: a) Excel Procedure: Enter X and Y data in Excel Go to Data Click on Data Analysis……..>…
Q: The table below shows the number of state-registered automatic weapons and the murder rate for…
A: The independent variable is thousands of automatic weapons. The dependent variable is murders per…
Q: Consider the following data on x = weight (pounds) and y = price ($) for 10 road-racing bikes. Brand…
A:
Q: The table below shows the number of state-registered automatic weapons and the murder rate for…
A:
Q: 2) Given are five observations collected in a regression study on two variables. 3 5 4 7 30 30 25 28…
A: For the given data ( a Develop scatter plot ( b ) Find regression equation ( c ) Predict y when x =6
Q: Given are five observations for two variables, x and y. xi 1 2 3 4 5 yi 4 7 4 11 14 Develop…
A: Given are five observations for two variables, x and y. xi 1 2 3 4 5 yi 4 7 4 11 14
Q: Given are five observations for two variables, x and y. x 1 2 3 4 5 y 4 7 7 11 13 Develop the…
A:
Q: Consider the following data on x = rainfall volume (m³) and y = runoff volume (m3) for a particular…
A: Hello! As you have posted more than 3 sub parts, we are answering the first 3 sub-parts. In case…
Q: The table below shows the number of state-registered automatic weapons and the murder rate for…
A: given x=thousand of automatic weapon y=murder per 100000 residents we need to find a)how many…
Q: The following data show the brand, price ($), and the overall score for six stereo headphones that…
A: (a) Use EXCEL to obtain the values of SST, SSR and SSE. EXCEL procedure: Go to EXCEL Go to…
Q: Given are five observations for two variables, x and y. 3 12 6 20 14 Vi 55 40 55 10 15 a. Develop a…
A: Given : X Y 3 55 12 40 6 55 20 10 14 15
Q: You may need to use the appropriate technology to answer this question. Consider the following data…
A: Correct option: Option 5
Q: Consider the following set of ordered pairs. x 4 2 4 2 7 6 y 4 9 7 6 2 5 a) Calculate the…
A: Given: The dataset of x and y is as follows
Q: Given are five observations for two variables, x and y. x 5 11 8 23 18 y 50 47 50 10 23 Develop the…
A: The value of slope and intercept of the regression line are computed as follows:
Q: The following data show the brand, price ($), and the overall score for six stereo headphones that…
A: Solution
Q: Develop an estimated regression equation for the data of the form ŷ = b0 + b1x + b2x2. (Round b0…
A: The scatterplot is obtained by using EXCEL. The software procedure is given below: In first column…
Q: Given are five observations for two variables, x and y. xi 1 2 3 4 5 yi 4 6 5 9 14 Develop…
A: Given data, X Y X*Y X*X 1 4 4 1 2 6 12 4 3 5 15 9 4 9 36 16 5 14 70 25
Q: 1. Consider the following data for two variables, x and y.x 22 24 26 30 35 40y 12 21 33 35 40 36a.…
A: Hello. Since your question has multiple sub-parts, we will solve first three sub-parts for you. If…
Q: Given are five observations for two variables, x and y. xi -3 12 6 20 14 yi -55 40 55 10 15 Develop…
A: Given that
Q: Given are five observations for two variables, x and y. xi 1 2 3 4 5 yi 4 6 6 11 13 Develop the…
A: Given: n=5 The formulas of b0 and…
Q: the following data: Y 8 8. 2 2 4 6 1 4 4 7 1 the regression equation for predicting Y from X. ΣΧ SSx…
A: From the given information we find the solution.
Q: The following data show the brand, price ($), and the overall score for six stereo headphones that…
A: The independent variable is price. The dependent variable is overall score. We have to find the sum…
Q: Given are five observations for two variables, I 12 20 14 Yi 55 40 55 10 15 a. Develop a scatter…
A: Note: Hi there! Thank you for posting the questions. As there are several independent questions,…
Q: The table below shows the number of state-registered automatic weapons and the murder rate for…
A: Given , x = thousands of automatic weapons y = Murders per 100,000 Given regression equation , y…
Q: The table below shows the number of state-registered automatic weapons and the murder rate for…
A: From the provided information, The linear regression equation is as follow: y = 0.81x + 4.35 x =…
Q: Given are five observations for two variables, * and y. Excel File: data14-25.xlsx The estimated…
A: Given information:
Q: 1) Given are five observations collected in a regression study on two variables. 2 4 5 7 8 2 3 6 4…
A: Given data x 2 4 5 7 8 y 2 3 2 6 4
Q: Given are five observations for two variables, x and y. xi 3 12 6 20 14 yi 55 45 50 15 20 #1)…
A:
Q: The table below shows the number of state-registered automatic weapons and the murder rate for…
A: Given datax 11.8 8.2 6.9 3.9 2.3 2.4 2.6 0.6 y 14.2 11.2 10.2 7.5…
Q: 3. Given are five observations collected in a regression study on two variables. 2 6 9 13 20 Yi 7 18…
A: Solution-: Given data: X: 2,6,9,13,20 Y: 7,18,9,26,23 Our aim to find (a) Draw the scatter diagram…
Q: Given are 3 observations for two variables, x and y. 1 3 6. 10 What is the estimated regression…
A: x y x.y x.x 1 9 9 1 3 10 30 9 6 5 30 36
Q: Consider the data. x, 12 3 45 y, 4 8 5 11 12 The estimated regression equation for these data is ŷ =…
A: The given data is x y 1 4 2 8 3 5 4 11 5 12
Q: The following data show the brand, price ($), and the overall score for six stereo headphones that…
A: Introduction: Consider that x is the independent variable and y is the dependent variable. The size…
Q: The table below shows the number of state-registered automatic weapons and the murder rate for…
A:
Q: The following data show the brand, price ($), and the overall score for six stereo headphones that…
A: The sum of total is calculated by taking the squared difference of each response variable from the…
Q: Given are five observations collected in a regression study on two variables. xi 2 6 9 13 20…
A: Solution: b. The regression equation is obtained by using excel. Procedure: Enter the data in…
Q: The following data show the brand, price ($), and the overall score for six stereo headphones that…
A: Regression: In order to obtain the least square regression line, first perform regression analysis…
Q: Assume there is a positive linear correlation between the variable R (Return rate in percent of a…
A:


Trending now
This is a popular solution!

Step by step
Solved in 2 steps with 2 images

- The following fictitious table shows kryptonite price, in dollar per gram, t years after 2006. t= Years since 2006 0 1 2 3 4 5 6 7 8 9 10 K= Price 56 51 50 55 58 52 45 43 44 48 51 Make a quartic model of these data. Round the regression parameters to two decimal places.Olympic Pole Vault The graph in Figure 7 indicates that in recent years the winning Olympic men’s pole vault height has fallen below the value predicted by the regression line in Example 2. This might have occurred because when the pole vault was a new event there was much room for improvement in vaulters’ performances, whereas now even the best training can produce only incremental advances. Let’s see whether concentrating on more recent results gives a better predictor of future records. (a) Use the data in Table 2 (page 176) to complete the table of winning pole vault heights shown in the margin. (Note that we are using x=0 to correspond to the year 1972, where this restricted data set begins.) (b) Find the regression line for the data in part ‚(a). (c) Plot the data and the regression line on the same axes. Does the regression line seem to provide a good model for the data? (d) What does the regression line predict as the winning pole vault height for the 2012 Olympics? Compare this predicted value to the actual 2012 winning height of 5.97 m, as described on page 177. Has this new regression line provided a better prediction than the line in Example 2?Given are five observations for two variables, x and y. xi 1 2 3 4 5 yi 4 6 6 11 13 Develop the estimated regression equation by computing the values of b0 and b1 using b1 = Σ(xi − x)(yi − y) Σ(xi − x)2 and b0 = y − b1x. ŷ = (e) Use the estimated regression equation to predict the value of y when x = 2.
- 1. Consider the following data for two variables, x and y.x 22 24 26 30 35 40y 12 21 33 35 40 36a. Develop an estimated regression equation for the data of the form yˆ = b0 + b1x.b. Use the results from part (a) to test for a significant relationship between x and y.Use a = .05.c. Develop a scatter diagram for the data. Does the scatter diagram suggest an estimatedregression equation of the form yˆ = b0 + b1x + b2x2? Explain.d. Develop an estimated regression equation for the data of the form yˆ = b0 + b1x +b2x2.e. Refer to part (d). Is the relationship between x, x2, and y significant? Use a = .05.f. Predict the value of y when x = 25.Given are five observations for two variables, x and y. xi 3 12 6 20 14 yi 55 45 50 15 20 #1) Develop the estimated regression equation by computing the values of b0 and b1 using b1 = Σ(xi − x)(yi − y) Σ(xi − x)2 and b0 = y − b1x. y= #2) Use the estimated regression equation to predict the value of y when x = 13.Consider the following data for two variables, x and y. x 9 32 18 15 26 y 9 19 20 15 22 Develop an estimated regression equation for the data of the form ŷ = b0 + b1x + b2x2. (Round b0 to two decimal places and b1 to three decimal places and b2 to four decimal places.) ŷ = (c) Use the model from part (b) to predict the value of y when x = 20. (Round your answer to two decimal places.)
- Given are five observations for two variables, x and y. xi 1 2 3 4 5 yi 4 6 5 9 14 Develop the estimated regression equation by computing the the slope and the y intercept of the estimated regression line (to 1 decimal). y^= + x Use the estimated regression equation to predict the value of y when x = 5 (to 1 decimal).y^ =The grades of a sample of 9 students on a prelim exam (x) and on the midterm exam (y) are shown below. Find the regression equation. y = 34.661 + 0.433x y = 0.777 + 12.0623x y = 12.0623 + 0.777x y = 34.661 - 0.433xThe director of marketing at Vanguard Corporation believes that sales of the company's Bright Side laundry detergent (S) are related to Vanguard's own advertising expenditure (A), as well as the combined advertising expenditures of its three biggest rival detergent (R). The marketing director collects 36 weekly observations on S, A and R to estimate the following multiple regression equation: S = a + bA + cR .where, S, A, and R are measured in dollars per week. Vanguard's marketing director is comfortable using parameter estimates that are statistically significant at the 10% level or better.DEPENDENT VARIABLE: S R-SQUARE F-RATIO P-VALUE ON FOBSERVATIONS: 36 0.2247 4.781 0.0150VARIABLE PARAMETER STANDARD T-RATIO P-VALUE ESTIMATE ERRORINTERCEPT 175086.0 63821.0 2.74 0.0098A 0.8550 0.3250…
- A statistical program is recommended. Consider the following data for two variables, x and y. x 22 24 26 30 35 40 y 12 22 34 36 41 37 (d) Develop an estimated regression equation for the data of the form ŷ = b0 + b1x + b2x2. (Round b0 to one decimal place and b1 to two decimal places and b2 to four decimal places.) ŷ = −175+12.63x−.1837x2 Use the results from part (d) to test for a significant relationship between x, x2, and y. Use α = 0.05. Is the relationship between x, x2, and y significant? Find the value of the test statistic. (Round your answer to two decimal places.) Find the p-value. (Round your answer to three decimal places.)Given are five observations collected in a regression study on two variables. xi 2 6 9 13 20 yi 7 18 9 26 23 Develop the estimated regression equation for these data. ŷ = (c) Use the estimated regression equation to predict the value of y when x = 20.Given are five observations collected in a regression study on two variables. xi 2 6 9 13 20 yi 9 18 8 25 21 (b) Develop the estimated regression equation for these data. ŷ = (c) Use the estimated regression equation to predict the value of y when x = 13.
