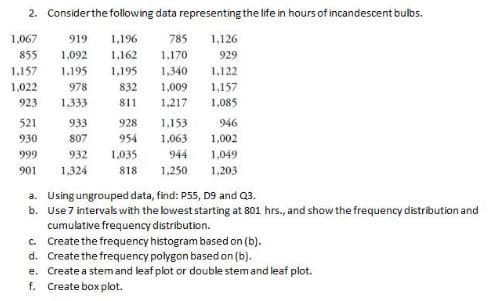
2. Considerthe following data representing the life in hours of incandescent bulbs. 1,067 919 1,196 785 1,126 855 1,092 1,162 1,170 929 1,157 1,195 1,195 1,340 1,122 1,157 1.085 1,022 978 832 1,009 923 1,333 811 1.217 521 933 928 1,153 946 930 807 954 1,063 1,002 999 932 1,035 944 1,049 901 1,324 818 1,250 1,203 a. Using ungrouped data, find: P55, D9 and Q3. b. Use 7 intervaks with the lowest starting at 801 hrs., and show the frequency distribution and cumulative frequency distribution. c. Create the frequency histogram based on (b). d. Create the frequency polygon based on (b). e. Create a stemand leaf plot or double stem and leaf plot. f. Create box plot.
2. Considerthe following data representing the life in hours of incandescent bulbs. 1,067 919 1,196 785 1,126 855 1,092 1,162 1,170 929 1,157 1,195 1,195 1,340 1,122 1,157 1.085 1,022 978 832 1,009 923 1,333 811 1.217 521 933 928 1,153 946 930 807 954 1,063 1,002 999 932 1,035 944 1,049 901 1,324 818 1,250 1,203 a. Using ungrouped data, find: P55, D9 and Q3. b. Use 7 intervaks with the lowest starting at 801 hrs., and show the frequency distribution and cumulative frequency distribution. c. Create the frequency histogram based on (b). d. Create the frequency polygon based on (b). e. Create a stemand leaf plot or double stem and leaf plot. f. Create box plot.

Functions and Change: A Modeling Approach to College Algebra (MindTap Course List)
6th Edition
ISBN:9781337111348
Author:Bruce Crauder, Benny Evans, Alan Noell
Publisher:Bruce Crauder, Benny Evans, Alan Noell
Chapter5: A Survey Of Other Common Functions
Section5.3: Modeling Data With Power Functions
Problem 6E: Urban Travel Times Population of cities and driving times are related, as shown in the accompanying...

Related questions
Question
Answer the E and F only. Thank you
Transcribed Image Text:2. Considerthe following data representing the life in hours of incandescent bulbs.
1,067
919
1,196
785
1,126
855
1,092
1,162
1,170
929
1,157
1,195
1,195
1,340
1,122
1,157
1.085
1,022
978
832
1,009
923
1,333
811
1.217
521
933
928
1,153
946
930
807
954
1,063
1,002
999
932
1,035
944
1,049
901
1,324
818
1,250
1,203
a. Using ungrouped data, find: P55, D9 and Q3.
b. Use 7 intervas with the lowest starting at 801 hrs., and show the frequency distribution and
cumulative frequency distribution.
c. Create the frequency histogram based on (b).
d. Create the frequency polygon based on (b).
e. Create a stemand leaf plot or double stem and leaf plot.
f. Create box plot.
Expert Solution
This question has been solved!
Explore an expertly crafted, step-by-step solution for a thorough understanding of key concepts.

Step by step
Solved in 3 steps with 2 images

Recommended textbooks for you
Functions and Change: A Modeling Approach to Coll…
Algebra
ISBN:
9781337111348
Author:
Bruce Crauder, Benny Evans, Alan Noell
Publisher:
Cengage Learning
Functions and Change: A Modeling Approach to Coll…
Algebra
ISBN:
9781337111348
Author:
Bruce Crauder, Benny Evans, Alan Noell
Publisher:
Cengage Learning